Select the method or formula of your choice.
Plotted points
|Si|, which is the determinant of the sample covariance matrix for sample i.
If no subgroups exist, all formulas for the Generalized Variance chart cannot be calculated. In this case, Minitab standardizes all values by subtracting the appropriate column mean and then dividing by the square root of the appropriate variance from the covariance matrix of all the data.
When the data are in subgroups, the chart displays a missing value for any subgroup that is an individual observation. The chart also displays a missing value if the size for a subgroup is less than or equal to the number of variables on the chart.
See Montgomery1 for more information on Generalized Variance charts.
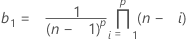
Center line
Control limits
Lower control limit (LCL)
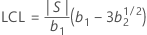
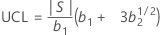
where:

The minimum LCL value is 0.
Upper control limit (UCL)
Notation
| Term | Description |
|---|---|
| p | number of variables |
| n | number of observations in each subgroup |
Methods and formulas for Box-Cox
Box-Cox formula
If you use a Box-Cox transformation, Minitab transforms the original data values (Yi) according to the following formula:
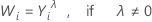
where λ is the parameter for the transformation. Minitab then creates a control chart of the transformed data values (Wi). To learn how Minitab chooses the optimal value for λ, go to Methods and formulas for Box-Cox Transformation.
Common λ values
| λ | Transformation |
|---|---|
| 2 |  |
| 0.5 |  |
| 0 |  |
| −0.5 |  |
| −1 |  |