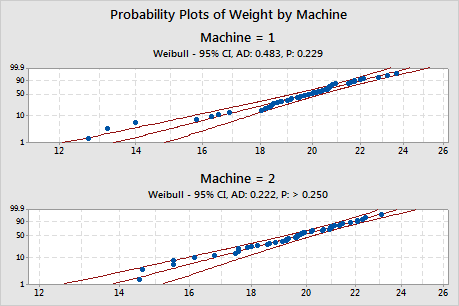
A manufacturer uses two machines to make plastic pellets. A quality engineer wants to assess the process capability of each machine. The engineer randomly samples 50 pellets from each machine and records the weight of each pellet. The specification range is 12 g to 25 g. The engineer knows that the weight of the pellets follows a Weibull distribution.
The engineer performs nonnormal capability analysis for multiple variables to evaluate how well the weight of the pellets meets customer requirements for the two machines.
- Open the sample data, PelletWeight.MTW.
- Choose .
- In Variables, enter Weight.
- Select By variables and enter Machine.
- From Fit distribution, select Weibull.
- In Lower spec, enter 12.
- In Upper spec, enter 25.
- Click OK.
Interpret the results
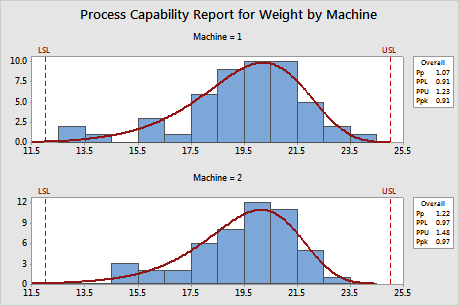
The Ppk is 0.91 for machine 1 and 0.97 for machine 2. Therefore, the overall capability of machine 2 is slightly better than that of machine 1. However, the capability indices for both machines are below 1.33, which is the generally accepted minimum value for a capable process. Process performance increases when the process spread is reduced and the process median lies close to the specification midpoint. For both machines, the process median is off the specification midpoint and the process spread is too large relative to the specification limits. The manufacturer needs to improve the process.