A manager at a fitness facility wants to determine whether a weight-loss program is effective. The manager wants to be able to detect a difference of at least 3 pounds. In an earlier study, the manager determined that the standard deviation of the paired differences is 5. Before collecting the data for a paired t-test, the manager uses a power and sample size calculation to determine what the power of the test will be with different sample sizes.
- Choose .
- In Sample sizes, enter 10 20 50.
- In Differences, enter 3.
- In Standard deviation of paired differences, enter 5.
- Click OK.
Interpret the results
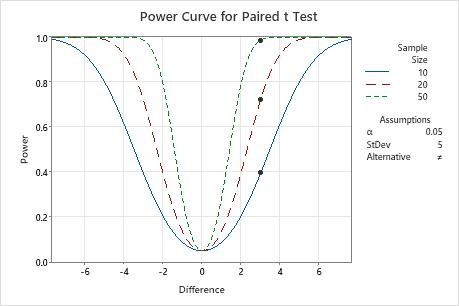
To detect a difference of 3 pounds in the weight-loss program, the manager can obtain a power value of approximately 0.4 with a sample size of 10, a power value of approximately 0.72 with a sample size of 20, and a power value of approximately 0.99 with a sample size of 50. A sample size of 20 or fewer does not give the test adequate power to detect a difference of 3, and a sample size of 50 may give the test too much power.
Results
| Difference | Sample Size | Power |
|---|---|---|
| 3 | 10 | 0.395918 |
| 3 | 20 | 0.721005 |
| 3 | 50 | 0.986031 |