The director of quality for a group of hospitals wants to assess the medication error rate. Examples of errors include delivering medication at the wrong time, delivering the wrong dose, and delivering the wrong medication. The director records the number of patients and the number of medication errors each week for 32 weeks.
The average subgroup size is more than 7500. Because of the large number of patients, the director uses a U chart diagnostic test to test for overdispersion.
- Open the sample data, MedicationErrors.MTW.
- Choose .
- In Variables, enter Errors.
- In Subgroup sizes, enter Patients.
- Click OK.
Interpret the results
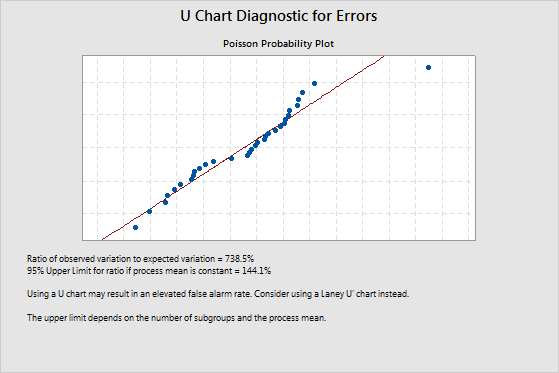
The ratio of observed variation to expected variation is 738.5%. This value indicates overdispersion because it is greater than the upper confidence limit of 144.1%. Overdispersion can cause points on a traditional U chart to appear to be out of control when they are not. To adjust for overdispersion, the director should use a Laney U' chart to monitor medication errors instead of a traditional U chart.
For more information on overdispersion and underdispersion, go to Overdispersion and underdispersion