About y-scale type
By default, the y-scale of a histogram represents frequency (each bar represents the frequency of values within the specified bin), emphasizing the magnitude of each bin. If your audience doesn't have enough process knowledge to understand the frequency values, you can change the graph's y-scale type to recast these frequency values as percentages (each bar represents the percentage of all values within the bin), a format they may find more meaningful.
Y-scale type for histograms
By default each bar represents the frequency of values within the bin. Change the y-scale type to Percent to make each bar represent the percentage of all values within the bin. Use Density when you want to compare distributions and the sample size differs. Density is also useful when you compare bars and the bin widths are unequal. Density is calculated as the proportion of observations divided by the bin width.
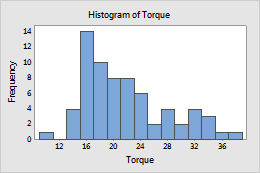
Frequency (default)

Percent
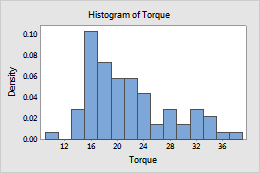
Density
- Click Scale.
- Select the type on the Y-Scale Type tab.
- Double-click the graph.
- Double-click the y-scale to open the Edit Scale dialog box.
- On the Type tab, specify the scale type.
- Frequency
- The height of each bar represents the number of observations that fall within the bin.
- Percent
- The height of each bar represents the percentage of the sample observations that fall within the bin. A histogram with a percentage scale is sometimes called a relative frequency histogram. Use a percent scale to compare samples of different sizes.
- Density
- The area of each bar represents the proportion of the sample observations that fall within the bin (proportion = bar area = bin width × bar height).
Accumulate values across bins: (Frequency and percent scales only) The bar heights accumulate from left to right. The height of each bar is equal the height of the bin plus all the previous bins.
Y-scale type for probability plots and empirical CDF plots
- Click Scale.
- Select the type on the Y-Scale Type tab.
- Double-click the graph.
- Double-click the y-scale to open the Edit Scale dialog box.
- On the Type tab, specify the scale type.
- Percent
-
Values on the y-axis represent estimated cumulative percentages. The estimated cumulative percentage is equal to the estimated cumulative probability multiplied by 100.
- Probability
-
Values on the y-axis represent estimated cumulative probabilities. The cumulative probability for a value x is the probability that a random observation that is taken from the population will be less than or equal to x.
Minitab uses the median rank method (also called the Benard method) to estimate the cumulative probability (r) for each observation:

In this formula, i is the rank of the observation in the sample and n is the total number of observations in the sample. For the smallest value in the sample, i = 1 and for the largest value in the sample, i = n.
- Score (Probability plot only)
-
Values on the y-axis represent inverse cumulative probabilities.
The score values for the normal distribution and the lognormal distribution are the inverse cumulative probability of r, calculated using the standard normal distribution.
The score values for the exponential distribution and the Weibull distribution are calculated as LN(−LN(1−r)), where LN is the natural log function.
Y-scale type for dendrograms
- Double-click the graph.
- Double-click the y-scale to open the Edit Scale dialog box.
- On the Type tab, specify the scale type.
- Similarity (default)
- The height of each cluster represents the similarity. The similarity, s(ij), between two clusters i and j is given by s(ij) = 100 (1- d(ij) / d(max). If you entered the original distance matrix D for the analysis, then d(max) is the maximum value in D. If D was calculated from data, then d(max) = 2 if you selected correlation as the distance measure and 1 if you selected absolute correlation as the distance measure.
- Distance
- The height of each cluster represents the distance.