Interval bars show the central tendency and variability of sample distributions. By default, interval plots display 95% confidence intervals for the mean.
The following interval plot displays a confidence bar for the mean height of plants for each fertilizer type. 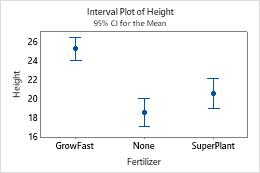
Add interval bars
To add interval bars when you create a graph, click Data View. To add interval bars to an existing graph, use the following steps:
- Double-click the graph.
- Right-click the graph and choose .
Edit interval bars
You can change the appearance, interval type, and location of the bars.
- Double-click the graph.
- Select and double-click the interval bars that you want to edit.
Note
For more information on selection, go to Select groups and single items on a graph.
- Make the edits that you want.
- Edit the appearance of the bars
- On the Attributes tab, you can edit the line type, line color, and line size of the selected interval bars.
- Edit the interval type
-
On the Options tab, under Type of Interval, select one of the following:
- Standard error: Represents one standard error (or a multiple of the standard error) from the mean. The standard error of the mean (SE of the mean) estimates the variability between sample means that you would obtain if you took multiple samples from the same population. In Multiple, enter a positive number to be used as the multiplier for standard errors.
- Confidence interval (default): Represents the 95% confidence interval for the mean. For more information, go to What is a confidence interval?
- In Level, enter the level of confidence for the confidence interval. Usually, a confidence level of 95% works well. A 95% confidence level indicates that, if you take 100 random samples from the population, the confidence intervals for approximately 95 of the samples will contain the population parameter. For more information, go to What is a confidence level?
- Select Bonferroni to use the Bonferroni method for controlling the simultaneous confidence level for an entire set of confidence intervals. If you don't select Bonferroni, confidence levels apply to the individual intervals. For more information, go to What is the Bonferroni method?.
- Select the location of the bars
- On the Options tab, from Side, select one of the following.
- two-sided: bars are drawn above and below the mean.
- upper one-sided: bars are above the mean.
- lower one-sided: bars are below the mean.
- Pool error across groups
- Use the pooled degrees of freedom to calculate the critical value from the t-distribution for confidence interval bars, or a pooled standard error instead of calculating the error for each subgroup for standard error bars.