In This Topic
Dixon's test statistics
- i indicates the number of extreme values on the same side (lower or upper) of the data as the suspected outlier. i = 1 or 2.
- j indicates the number of extreme values on the opposite side of the data. j = 0, 1, or 2.
For example, if the suspected outlier is the smallest value in the sample, but the sample also includes two unusually large values, then r12 is the appropriate test statistic. The test statistic r10 , (also called Dixon's Q), is appropriate when the sample includes only one extreme value.
Critical values for Dixon's test statistics are tabulated in Rorabacher (1991).
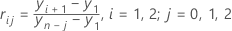
One-sided test statistics
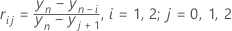
Two-sided test statistics

Notation
| Term | Description |
|---|---|
| rij | Dixon's test statistic (i = 1, 2; j = 0, 1, 2) |
| yi | the ith smallest value in the sample |
| n | the number of observations in the sample |
References
- D.B. Rorabacher (1991). "Statistical Treatment for Rejection of Deviant Values: Critical Values of Dixon Q Parameter and Related Subrange Ratios at the 95 percent Confidence Level," Analytic Chemistry, 83, 2, 139-146.
- E.P. King (1953). "On Some Procedures for the Rejection of Suspected Data," Journal of the American Statistical Association, Vol. 48, No. 263, 531-533.
Grubbs' test statistic
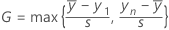
Formula for the one-sided statistic


Formula for the two-sided statistic
Notation
| Term | Description |
|---|---|
 | the sample mean |
| yi | the ith smallest value in the sample |
| s | the standard deviation of the sample |
| n | the number of observations in the sample |
P-values for Dixon's test statistics

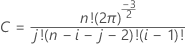
Cumulative distribution function for the test statistic


Minitab evaluates the inner integral using a 30-point Gauss-Laguerre quadrature. Minitab evaluates the outer integral using a 30-point Gauss-Hermite quadrature.

Similar to McBane (2006), Minitab calculates Fij(r) using a 16-point Gauss-Legendre quadrature method.
P-value for one-sided test

P-value for one-sided test

Also, King observes that the above approximation becomes an equality for  .
.
Notation
| Term | Description |
|---|---|
| rij | the Dixon test statistic where i = 1, 2; j = 0, 1, 2 |
| yi | the ith smallest value in the sample |
| n | the number of observations in the sample |
References
W.J. Dixon (1951). "Ratios Involving Extreme Values," Annals of Mathematical Statistics, 22(1), 68-78.
E.P. King (1953). "On Some Procedures for the Rejection of Suspected Data," Journal of the American Statistical Association, Vol. 48, No. 263, pages 531-533.
G.C. McBane (2006). "Programs to Compute Distribution Functions and Critical Values for Extreme Value Ratios for Outlier Detection," Journal of Statistical Software, Vol. 16, No. 3, pages 1-9.
P-values for Grubbs' test statistic
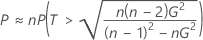
Formula for a one-sided test
Formula for a two-sided test
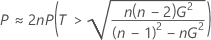
Exact versus approximate p-values

If not, the calculated p-value represents an upper bound for the exact p-value. However, the upper bound is a very good approximation of the exact p-value.
Notation
| Term | Description |
|---|---|
| G | Grubbs' test statistic |
| n | the number of observations in the sample |
| T | a random variable distributed as a t-distribution with n – 2 degrees of freedom |