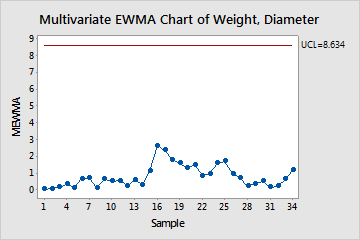
A production manager monitors the diameter and weight of bowls that are manufactured at a plant to ensure consistency. The manager collects three bowls per day and measures their diameters and weights.
The production manager creates a multivariate EWMA chart to simultaneously monitor the diameter and weights of bowl over time.
- Open the sample data, BowlConsistency.MTW.
- Choose .
- In Variables, enter Weight Diameter.
- In Subgroup sizes, enter Day.
- Click OK.
Interpret the results
None of the subgroup ranges are above the control limit. This chart does not provide any evidence for lack of control. Thus, the process mean vector is in control.