In This Topic
Plotted points
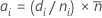
Adjusted counts
Minitab calculates the adjusted defective counts (ai) as follows:
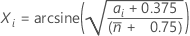
Transformed counts
The adjusted counts are then transformed using the following formula:
Then Minitab creates a standard normal probability plot of the transformed counts using the method specified in .
Notation
| Term | Description |
|---|---|
| di | count of defectives for subgroup i |
| ni | size of subgroup i |
 | average subgroup size |
Ratio of observed variation to expected variation
Expected variation
The expected variation is equal to the standard deviation of the transformed counts (Xi), which is equal to  .
.
Observed variation
To calculate the observed variation, Minitab calculates normal scores (Y,) for the transformed counts as follows:
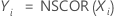
where NSCOR is the Normal scores function (available by choosing ).
For the next step, only the middle 50% of the Xi values are used, along with their corresponding Yi values. Xi values are excluded if they are less than the 25th percentile or greater than the 75th percentile.
Minitab fits a least squares regression model with Yi as the response and Xi as the predictor:

The observed variation is then 1 / β1.
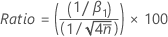
Ratio
The ratio of observed variation to expected variation is calculated as follows:
Notation
| Term | Description |
|---|---|
| Xi | transformed counts (For more information, see the section "Plotted points".) |
 | average subgroup size |
| β0 | intercept from the least squares regression equation |
| β1 | slope coefficient from the least squares regression equation |
95% confidence limits for ratio
upper confidence limit
The upper confidence limit for the ratio is calculated as follows:

where  is the mean proportion of defectives, calculated as follows:

lower confidence limit
For the lower confidence limit for the ratio, Minitab uses a conservative, fixed value of 60%.
Notation
| Term | Description |
|---|---|
| m | number of subgroups |
 | average subgroup size |
| di | count of defectives for subgroup i |
| ni | size of subgroup i |
Decision
- If ratio > upper confidence limit
- If the ratio is greater than the upper confidence limit, then using a traditional P chart with the data may result in an elevated false alarm rate. In this case, a Laney P' chart is recommended.
- If ratio < lower confidence limit
- If the ratio is less than the lower confidence limit, then using a traditional P chart with the data may result in control limits that are too wide. In this case, a Laney P' chart is recommended.