Use P Chart Diagnostic to test for overdispersion or underdispersion in your defectives data. A defective item has one or more defects that make it not acceptable. Overdispersion can cause a traditional P chart to show an increased number of points outside the control limits. Underdispersion can cause a traditional P chart to show too few points outside of the control limits. The Laney P' chart adjusts for these conditions.
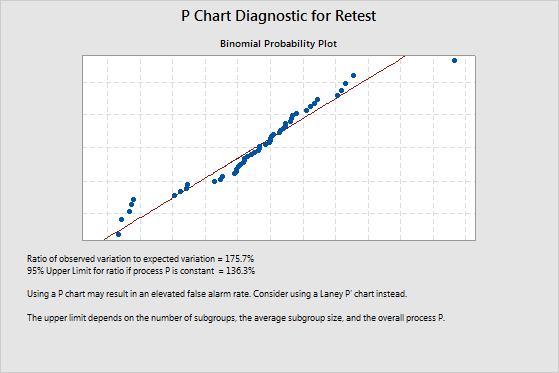
For example, the radiology department at a hospital wants to track the proportion of patients that require a retest due to imaging errors. Because the volume of patients is high, the department uses a P chart diagnostic test to check for overdispersion in the data. The ratio of observed variation to expected variation is 175.7%. This value indicates overdispersion because it is greater than the upper confidence limit of 136.6%. The department should use a Laney P' chart instead of a traditional P chart to track the proportion of defectives.
Where to find this analysis
To perform a P chart diagnostic test, choose .
When to use an alternate test
A defective item has one or more defects that make it not acceptable. If you can determine only whether an item is defective or nondefective, use this test. If you can count the number of defects on each item, use U Chart Diagnostic.