Use Multivariate EWMA
Chart to simultaneously monitor two or more related process characteristics in an exponentially weighted control chart. In the multivariate EWMA chart, each plotted point includes weighting from all previous data, which helps you to detect small process shifts quicker than you can with other multivariate control charts. The Multivariate EWMA chart is the multivariate counterpart to the EWMA chart.
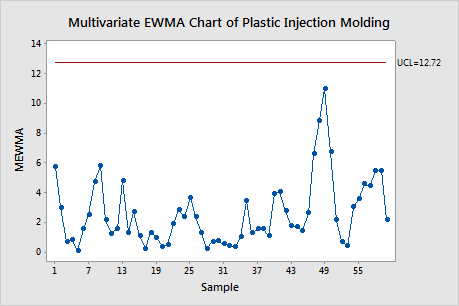
For example, use a multivariate EWMA chart to monitor temperature and pressure in a plastic injection-molding process. Because temperature and pressure both affect the plastic strength, the engineer wants to monitor these variables at the same time.
No points are above the upper control limit, so the variability can be considered stable. However, the points that are higher than the rest that could be investigated.
Where to find this control chart
To create a multivariate EWMA chart, choose Stat > Control Charts > Multivariate Charts > Multivariate EWMA.