A critical value is a point on the distribution of the test statistic under the null hypothesis that defines a set of values that call for rejecting the null hypothesis. This set is called critical or rejection region. Usually, one-sided tests have one critical value and two-sided test have two critical values. The critical values are determined so that the probability that the test statistic has a value in the rejection region of the test when the null hypothesis is true equals the significance level (denoted as α or alpha).
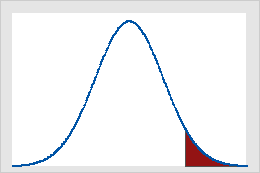
Figure A
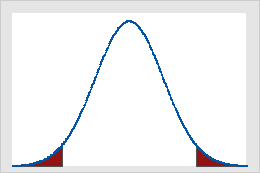
Figure B
Critical values on the standard normal distribution for α = 0.05
Figure A shows that results of a one-tailed Z-test are significant if the value of the test statistic is equal to or greater than 1.64, the critical value in this case. The shaded area represents the probability of a type I error (α = 5% in this example) of the area under the curve. Figure B shows that results of a two-tailed Z-test are significant if the absolute value of the test statistic is equal to or greater than 1.96, the critical value in this case. The two shaded areas sum to 5% (α) of the area under the curve.
Examples of calculating critical values
In hypothesis testing, there are two ways to determine whether there is enough evidence from the sample to reject H0 or to fail to reject H0. The most common way is to compare the p-value with a pre-specified value of α, where α is the probability of rejecting H0 when H0 is true. However, an equivalent approach is to compare the calculated value of the test statistic based on your data with the critical value. The following are examples of how to calculate the critical value for a 1-sample t-test and a One-Way ANOVA.
Calculating a critical value for a 1-sample t-test
- Select .
- Select Inverse cumulative probability.
- In Degrees of freedom, enter 9 (the number of observations minus one).
- In Input constant, enter 0.95 (one minus one-half alpha).
This gives you an inverse cumulative probability, which equals the critical value, of 1.83311. If the absolute value of the t-statistic value is greater than this critical value, then you can reject the null hypothesis, H0, at the 0.10 level of significance.
Calculating a critical value for an analysis of variance (ANOVA)
- Choose .
- Select Inverse cumulative probability.
- In Numerator degrees of freedom, enter 2 (the number of factor levels minus one).
- In Denominator degrees of freedom, enter 9 (the degrees of freedom for error).
- In Input constant, enter 0.95 (one minus alpha).
This gives you an inverse cumulative probability (critical value) of 4.25649. If the F-statistic is greater than this critical value, then you can reject the null hypothesis, H0, at the 0.05 level of significance.