A quality analyst is planning an experiment and wants to determine whether the experiment will have adequate power. The planned experiment will determine whether 4 treatments affect the yield of a product using five observations per treatment. The analyst knows that the mean of the control group is approximately 8, and would like to find significant differences of at least 4. Previous research indicates the standard deviation of the population is 1.64.
- Choose .
- In Number of levels, enter 4.
- In Sample sizes, enter 5.
- In Values of the maximum difference between means, enter 4.
- In Standard deviation, enter 1.64.
- Click OK.
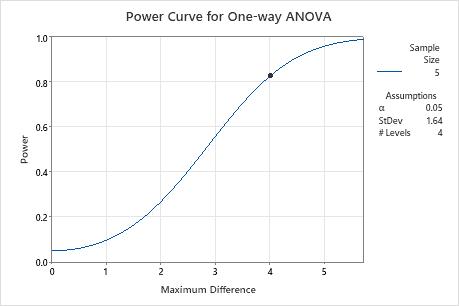
Interpret the results
If the analyst assigns five observations to each treatment level, the power to detect a difference of 4 units or more between the treatment means is approximately 0.83. Minitab displays the power curve of all possible combinations of power values and the maximum difference in the mean of the 5 groups. The symbol on the curve represents the difference value that the analyst specified.
Results
| Maximum Difference | Sample Size | Power |
|---|---|---|
| 4 | 5 | 0.826860 |