In This Topic
Ratio

Notation
| Term | Description |
|---|---|
| ρ | Ratio |
 | Test mean |
 | Reference mean |
Means and standard deviations
 , is given by:

The mean of the reference sample,  , is given by:

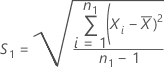
The standard deviation of the test sample, S1, is given by:
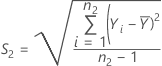
The standard deviation of the reference sample, S2, is given by:
Notation
| Term | Description |
|---|---|
| X i | Observations from the test sample, with i = 1, ..., n1 |
| Y i | Observations from the reference sample, with i = 1, ..., n2 |
| n1 | Number of observations in the test sample |
| n2 | Number of observations in the reference sample |
Equivalence limits
Let k1 be the value that you specify for the lower limit and k2 be the value that you specify for the upper limit. By default, the lower equivalence limit, δ1, is given by:

and the upper equivalence limit, δ2, is given by:

Degrees of freedom (DF)
Do not assume equal variances (default)
By default, the degrees of freedom for the test, v, are given by the following formula:
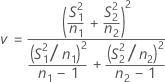
Minitab displays v rounded down to the nearest integer.
Assume equal variances
If you select the option to assume equal variances, then Minitab calculates the degrees of freedom as follows:

Notation
| Term | Description |
|---|---|
| S1 | Standard deviation of the test sample |
| n1 | Number of observations in the test sample |
| S2 | Standard deviation of the reference sample |
| n2 | Number of observations in the reference sample |
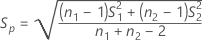
Pooled standard deviation
Notation
| Term | Description |
|---|---|
| Sp | Pooled standard deviation |
| S1 | Standard deviation of the test sample |
| n1 | Number of observations in the test sample |
| S2 | Standard deviation of the reference sample |
| n2 | Number of observations in the reference sample |
Confidence interval
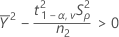
Minitab cannot calculate the confidence interval (CI) if any of the following three conditions are not met:

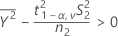
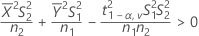
Do not assume equal variances (default)
- 100(1 - α)% CI
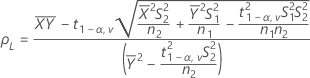
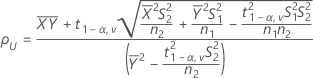
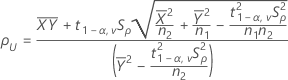
By default, Minitab calculates the 100(1 - α)% CI for ρ as follows:
CI = [min(C, ρL), max(C, ρU)]
where:
- 100(1 - 2α)% CI
If you select the option to use the 100(1 - 2α)% CI, then the CI is given by the following:
CI = [ρL, ρU]
Assume equal variances
If you select the option to assume equal variances, then the CI is calculated as follows.
Minitab cannot calculate the CI if any of the following three conditions are not met:

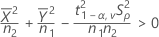
- 100(1 -α)% CI
Minitab calculates the 100(1 - α)% CI as follows:
CI = [min(C, ρL, max(C, ρU)]
Where: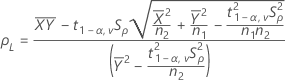
- 100(1 - 2 α)% CI
If you select the option to use the 100(1 - 2 α)% CI, then the CI is given by the following:
CI = (ρL, ρU)
One-sided intervals
For a hypothesis of Test mean / reference mean > lower limit, the 100(1 - α)% lower bound is equal to ρL.
For a hypothesis of Test mean / reference mean < upper limit, the 100(1 - α)% upper bound is equal to ρU.
Notation
| Term | Description |
|---|---|
 | Mean of the test sample |
 | Mean of the reference sample |
| S1 | Standard deviation of the test sample |
| n1 | Number of observations in the test sample |
| S2 | Standard deviation of the reference sample |
| n2 | Number of observations in the reference sample |
| δ1 | Lower equivalence limit |
| δ2 | Upper equivalence limit |
| Sρ | Pooled standard deviation |
| v | Degrees of freedom |
| α | Significance level for the test |
| t1-α,v | Upper 1 - α critical value for a t-distribution with v degrees of freedom |
T-values
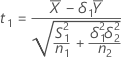
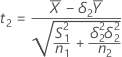
Do not assume equal variances (default)
Let t1 be the t-value for the hypothesis, , and let t2 be the t-value for the hypothesis,
  , where Λ is the ratio of the mean of the test population to the mean of the reference population. By default, the t-values are calculated as follows:
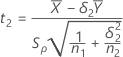
Assume equal variances
If you select the option to assume equal variances, then the t-values are calculated as follows: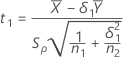
Notation
| Term | Description |
|---|---|
 | Mean of the test sample |
 | Mean of the reference sample |
| S1 | Standard deviation of the test sample |
| n1 | Number of observations in the test sample |
| S2 | Standard deviation of the reference sample |
| n2 | Number of observations in the reference sample |
| Sρ | Pooled standard deviation |
| δ1 | Lower equivalence limit |
| δ2 | Upper equivalence limit |
P-values
If  , then:
| H0 | P-Value |
|---|---|
 |
 |
 |
 |
Notation
| Term | Description |
|---|---|
| Λ | Unknown ratio of the mean of the test population to the mean of the reference population |
| δ1 | Lower equivalence limit |
| δ2 | Upper equivalence limit |
| v | Degrees of freedom |
| T | t-distribution with v degrees of freedom |
| t1 | t-value for the hypothesis  |
| t2 | t-value for the hypothesis  |
Note
For information on how the t-values are calculated, see the section on t-values.