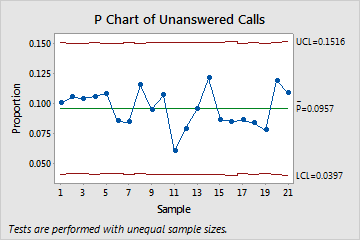
The supervisor for a call center wants to evaluate the process for answering customer phone calls. The supervisor records the total number of incoming calls and the number of unanswered calls for 21 days. The supervisor creates a P chart to monitor the proportion of unanswered calls.
- Open the sample data, UnansweredCalls.MTW.
- Choose .
- In Variables, enter Unanswered Calls.
- In Subgroup sizes, enter Total Calls.
- Click P Chart Options.
- On the Tests tab, select 1 point > K standard deviations from center line (Test 1) and K points in a row on same side of center line (Test 2).If you are not sure which tests apply in your specific situation, use Tests 1 and 2 when you first establish the control limits based on your data.
- Click OK in each dialog box.
Interpret the results
The chart shows that, on average, 9.57% of calls are unanswered. None of the subgroup proportions are outside of the control limits. Furthermore, the points inside the limits display a random pattern. This P chart does not provide any evidence for lack of control. Thus, the process is in control.