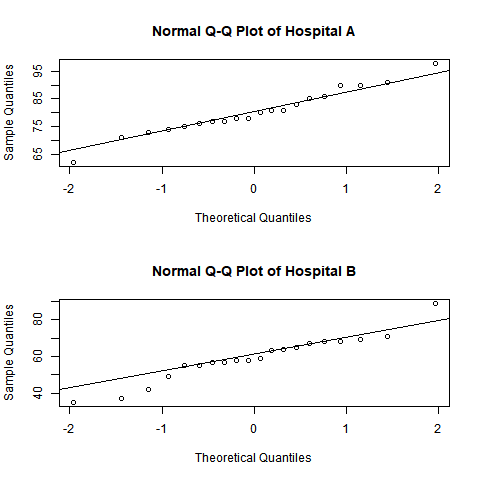
医療コンサルタントは、分位四分位数(QQ)プロットを使用して、2つの病院からの患者満足度評価の正常性を比較したいと考えています。QQプロットは、患者満足度評価の各セットが正規分布にどの程度適合するかを示しています。
この例では、RスクリプトがMinitabの列からデータを読み取ります。このスクリプトは、分位数を計算し、各列の QQ プロットを作成します。次に、スクリプトは、Minitab出力ペインにプロットを送信します。
このガイドで参照されるすべてのファイルは、次の.ZIPファイルで入手可能です:r_guide_files.zip.
このセクションの手順を実行するには、次のファイルを使用します。
| ファイル | 説明 |
|---|---|
| qq_plot.R | Minitabワークシートから列を取り出し、各列のQQプロットを表示するRスクリプト。 |
以下のRスクリプトの例では、以下のRパッケージが必要です:
- mtbr
- MinitabとRを統合するRパッケージ。この例では、このモジュールの関数からR結果がMinitabに送信されます。
- 次の必要なモジュールがインストールされていることを確認します:mtbr.
- mtbrパッケージをインストールするには、Rターミナルで次のコマンドを実行します:
install.packages("url-to-mtbr")
- mtbrパッケージをインストールするには、Rターミナルで次のコマンドを実行します:
- Rスクリプトファイル、qq_plot.RをMinitabのデフォルトのファイル位置に保存します。 Minitabが Rスクリプトファイルを探す場所の詳細については、MinitabのRファイルのデフォルトのフォルダを参照してください。
- ホテル比較非スタック.MWXサンプルデータを開きます。
- Minitabのコマンドプロンプトペインに、「
RSCR "qq_plot.R" "Hospital A" "Hospital B"」と入力します。 - 実行をクリックします。
qq_plot.R
require(mtbr, quietly=TRUE) column_names <- commandArgs(trailingOnly = TRUE) if (length(column_names) == 0) { current_index <- 1 while (length(mtbr::mtb_get_column(paste0("C",current_index))) > 0) { column_names[current_index] <- paste0("C", current_index) current_index <- current_index + 1 } } if (length(column_names) == 0 || length(mtbr::mtb_get_column(column_names[1])) == 0) { stop("Worksheet is empty or column data could not be found!\n\tPass columns to RSCR or move first column to C1.") } png("qqplot.png") par(mfrow=c(ceiling(length(column_names)/round(sqrt(length(column_names)))), round(sqrt(length(column_names))))) for (column_name in column_names) { column <- mtbr::mtb_get_column(column_name) qqnorm(column, main=paste0("Normal Q-Q Plot of ", column_name)) qqline(column) } graphics.off() mtbr::mtb_add_image("qqplot.png")結果
R Script

