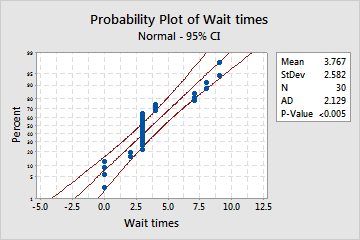
Use Probability Plot to evaluate the fit of a distribution to the data, to estimate percentiles, and to compare sample distributions. A probability plot displays each value versus the percentage of values in the sample that are less than or equal to it, along a fitted distribution line. The y-axis is transformed so that the fitted distribution forms a straight line.
For example, a bank manager creates a probability plot to examine the distribution of customer wait times.
Where to find this graph
To create a probability plot, choose .