About graph, figure, and data regions
Knowing where regions are is important for graph editing, especially if you have multiple graphs within a single graph region.
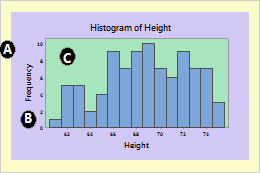
In this illustration, the graph, figure, and data regions are labeled.
- A: Graph region
-
The area just within the graph border that encompasses all the graphs, including their figure regions, data regions, legends, and tables. When you print a graph, the graph region corresponds to one sheet of paper.
Usually, the graph region contains a single graph. A layout may include several different graphs, but it still has only one graph region.
- B: Figure region
- The area just within the graph region that includes the data region, axes, labels, titles, and footnotes. Usually, graphs, including overlaid and paneled graphs, have only one figure region. You can only have multiple figure regions when you use the graph layout tool. A single figure region is transparent and takes up the entire graph region.
- C: Data regions
-
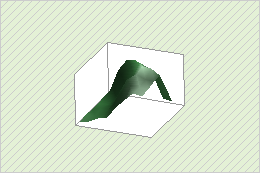
The area in which the data are displayed. You can put additional text, lines, symbols, and polygons in the data region. Pie charts and 3D graphs do not have data regions.
Modify or move a region
When you are editing a graph, the regions can be resized, relocated, and formatted with color, fill patterns, edge line types, and more. In addition, you can change the fonts for the legend and table regions. To edit a graph, double-click on the graph to open the Edit Graph dialog box. Then you can do one of the following:
- To modify a region, double-click it and complete the dialog box.
- To move a region, drag it to where you want it.
- To resize a region, click it and drag the sizing handles.
About region coordinate systems
Each region uses a coordinate system for positioning items within it. You might use a region's coordinate system if you are writing a macro, but usually, it is easier to position regions and annotations by dragging them.
- Data Units
-
Use data units to position items such as:
- Annotation, including text, lines, markers, and polygons
- Scale elements, including tick marks and reference lines
Data regions use the graph scales as coordinate systems. A categorical scale uses index values incrementing from left to right. The index value 1 signifies the first category, 2 signifies the second, and so on. A value of 1.5 corresponds to the point halfway between the first and second category.
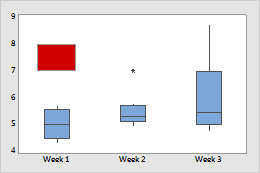
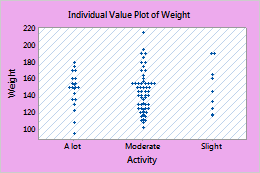
Coordinates on a graph with a categorical scale
The red rectangle is at Y minimum = 7, Y maximum = 8, X minimum = 0.75, and X maximum = 1.25.
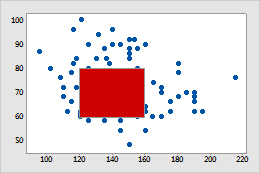
Coordinates on a graph with a continuous scale
The red rectangle is at Y minimum = 60, Y maximum = 80, X minimum = 120, X maximum = 160.
- Figure Units
-
Use figure units to position the following items that are specific to a particular graph:
- The data, legend, and output table regions
- Annotation items such as titles and footnotes
- Scale elements such as axis labels and tick labels
The figure coordinate system ranges from 0 to 1 in each direction, with x beginning at the left edge of the region and y beginning at the bottom.
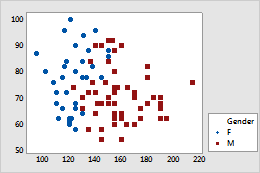
Legend positioned by figure units
The legend region is at coordinates X minimum = 0.8038, X maximum = 0.9923, Y minimum = 0.1264, Y maximum = 0.3448.
- Graph Units
-
Use graph units to position items relative to the entire graph. For example, position items such as:
- One or more figure regions on a graph region
- Annotation items for the graph region
The graph region coordinate system ranges from 0 to 1 in each direction, with the initial value of x at the left edge of the graph region and the initial value of y at the bottom.
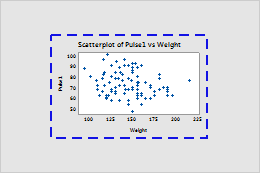
Figure region placed by graph units
The figure region is bounded by a dotted line and positioned at graph coordinates X minimum = 0.2, X maximum = 0.8, Y minimum = 0.2, Y maximum = 0.8.
Specify the position of a graph region or annotation using coordinates
Each region uses a coordinate system for positioning items within it. You might use a region's coordinate system if you are writing a macro, but usually it is easier to position regions and annotations by dragging them.
Tip
If you add annotation or move regions on a graph, you can copy the coordinates for those items. With the graph in editing mode, click the button on the toolbar. The coordinates are copied, along with the remainder of the command language that you can use to recreate the graph.
- Double-click the graph.
- Double-click the region or annotation item on the graph to open the editing dialog box.
- Click the Location tab and choose Custom.
- Enter the coordinates.
- Click OK.
Change the attributes of a graph, figure, or data region
- Double-click the graph.
- Double-click the scale to open the Edit Data Region or Edit Graph and Figure Regions dialog box.
- On the Graph Attributes tab (for graph and figure regions), or the Attributes tab (for data regions), change the fill pattern, border lines, and fill lines.
Note
The figure region, which is in front of the graph region and behind the data region, is transparent by default.