The procedure for the points on the lift chart depends on the
validation method. For a multinomial response variable, Minitab displays
multiple charts that treat each class as the event in turn.
Training data set or no validation
For the chart for a training data set, each point on the chart represents
a terminal node from the tree. The terminal node with the highest event
probability is the first point on the chart and appears leftmost. The other
terminal nodes are in order of decreasing event probability.
Use the following process to find the x- and y-coordinates for the
points.
Calculate the event
probability of each terminal node:
where
n1,k is the number of cases in the event class
in the
kth node
Nk is the number of cases in the
kth node
Rank the terminal nodes from
highest to lowest event probability.
For each terminal node,
assign the cases from the terminal node to the event class and the cases for
the other terminal nodes to the nonevent class.
For example, suppose the following table summarizes a tree with 4
terminal nodes:
A: Terminal node
B: Number of events
C: Number of cases
D: Threshold (B/C)
4
18
30
0.60
1
25
67
0.37
3
12
56
0.21
2
4
36
0.11
Totals
59
189
Then the following are the corresponding true positive rates to 2
decimal places:
A: Terminal node
B: Number of events
C: True positive rate
4
18
18 / 59 = 0.31
1
25
25 / 59 = 0.42
3
12
12 / 59 = 0.20
2
4
4 / 59 = 0.07
Totals
59
From the sorted terminal
nodes, find the percentage of the population in the terminal nodes:
where
Nk is the number of cases in the
kth node
N is the number of cases in the training data set
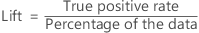
To find the lift for the
y-coordinate, divide the true positive rate and the percentage of the
population:
For the sorted terminal
nodes, calculate the cumulative percentage of the data in each terminal node.
These cumulative values are the x-coordinates on the chart.
For example, if the terminal node with the highest predicted
probability contains 0.16 of the data and the terminal node with the
second-highest event probability has 0.35 of the population, then the
cumulative percentage of the data for the first terminal node is 0.16 and the
cumulative percentage of the population for the second terminal node is 0.16 +
0.35 = 0.51.
The following table shows an example of the computations for a small tree.
The values are to 2 decimal places.
A: Terminal node
B: Number of events
C: Number of cases
D: Event probability for sorting (B/C)
E: True positive rate
F: Percent in data (C/ sum of C)
G: Cumulative percent in data, x-coordinate
H: Lift (E /F), y-coordinate
4
18
30
0.60
0.31
0.16
0.16
1.94
1
25
67
0.37
0.42
0.35
0.51
1.20
3
12
56
0.21
0.20
0.30
0.81
0.67
2
4
36
0.11
0.07
0.19
1.00
0.37
Separate test data set
Use the same steps as the training data set case but calculate the event
probability from the cases for the test data set.
Test with k-fold cross-validation
The procedure to define the x- and y-coordinates on the lift chart with
k-fold cross-validation has an additional step. This step creates many distinct
event probabilities. For example, suppose the tree diagram contains 4 terminal
nodes. We have 10-fold cross-validation. Then, for the ith fold, you
use 9/10 portion of the data to estimate the event probabilities for cases in
fold i. When this process repeats for each fold, the maximum number of distinct
event probabilities is 4 *10 = 40. After that, sort all the distinct event
probabilities in decreasing order and combine any distinct event probabilities
that need more cases to form a proper bin. After this step, steps from 3 to the
end for the training data set procedure apply to find the x- and y-coordinates.