An engineer wants to know whether the welding process creates more defects than it did previously. The engineer collects 80 parts and counts the number of rejected welds for each shift for a few days. Because the data have two possible outcomes, the data are binomial.
The analyst performs an analysis of means to determine whether the proportion of rejects is significantly different for any of the samples.
- Open the sample data, WeldRejects.MTW.
- Choose .
- In Response, enter WeldRejects.
- Under Distribution of Data, select Binomial and enter 80 in Sample size.
- Click OK.
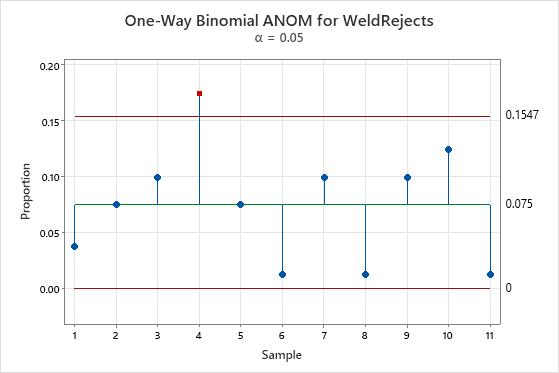
Interpret the results
The plot displays the proportion of defects for each sample, a center line representing the average proportion for all samples, and upper and lower decision limits. If the point representing a sample is outside the decision limits, the difference between that proportion and the average proportion is statistically significant. The proportion of defective welds in sample 4 is above the decision limits. The proportion of defective welds in this sample is unusually high.