To use this function, choose .
Percentiles divide the data set into parts. Usually, the nth percentile has n% of the observations below it, and (100-n)% of observations above it.
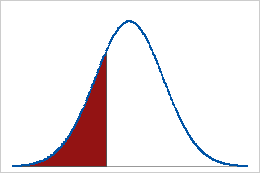
For example, in the following graph, 25% of the total data values lie below the 25th percentile (red region), while 75% lie above the 25th percentile (white region).
Syntax
PERCENTILE(number,probability)
Calculates the sample percentile, for a specified probability and number (the column containing the sample data). Missing values are ignored. The probability must be between 0 and 1, inclusive, and indicates the percentile. For example, to determine the 1st quartile (25th percentile) of a column of data, enter the column number and the probability 0.25.
Example
| Column | Calculator expression | Result |
|---|---|---|
| C1 contains 2, 3, 5, and 7 | PERCENTILE (C1,0.25) | 2.25 |
Formula
Minitab's calculator uses the empirical percentile function for the PERCENTILE function.

- Notation
-
Term Description p the percentage of data less than or equal to the desired percentile, divided by 100 Xy the yth row of the data when the data are sorted from least to greatest y the truncated value of w w p(N+1) N the number of rows with nonmissing data z w-y