What is the Anderson-Darling statistic?
The Anderson-Darling statistic measures how well the data follow a particular distribution. For a specified data set and distribution, the better the distribution fits the data, the smaller this statistic will be. For example, you can use the Anderson-Darling statistic to determine whether data meets the assumption of normality for a t-test.
- H0: The data follow a specified distribution
- H1: The data do not follow a specified distribution
Use the corresponding p-value (when available) to test if the data come from the chosen distribution. If the p-value is less than a chosen alpha (usually 0.05 or 0.10), then reject the null hypothesis that the data come from that distribution. Minitab does not always display a p-value for the Anderson-Darling test because it does not mathematically exist for certain cases.
You can also use the Anderson-Darling statistic to compare the fit of several distributions to determine which one is the best. However, in order to conclude one distribution is the best, its Anderson-Darling statistic must be substantially lower than the others. When the statistics are close together you should use additional criteria, such as probability plots, to choose between them.
| Distribution | Anderson-Darling | P-value |
|---|---|---|
| Exponential | 9.599 | p < 0.003 |
| Normal | 0.641 | p < 0.089 |
| 3-parameter Weibull | 0.376 | p < 0.432 |
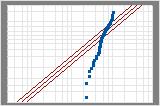
Exponential
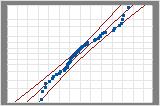
Normal
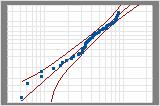
3-parameter Weibull
Examples of comparing distributions
These probability plots are for the same data. Both the normal distribution and the 3-parameter Weibull distribution provide a good fit for your data.
Minitab calculates the Anderson-Darling statistic using the weighted squared distance between the fitted line of the probability plot (based on the chosen distribution and using either maximum likelihood estimation method or least squares estimates) and the nonparametric step function. The calculation is weighted more heavily in the tails of the distribution.
Show the Anderson-Darling statistic on a normal probability plot
To display a legend showing the Anderson-Darling test statistic and p-value each time you create a normal probability plot of the residuals:
- Choose and
- Check Include Anderson-Darling test with normal plot. Click OK. Minitab does not display the test when there are less than 3 degrees of freedom for error.