- Equivalence plot
-
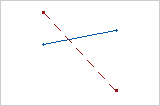
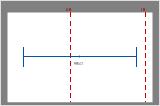
Use the equivalence plot to view a graphical summary of the equivalence test results and to determine whether you can claim equivalence.
An equivalence plot displays the equivalence limits, the confidence interval for equivalence, and the decision about whether you can claim equivalence.
- Subject profile plot
-
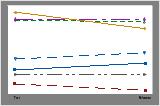
Use the subject profile plot to examine the responses of each participant to the test treatment and the reference treatment.
- Period plot
-
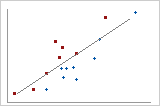
Use the period plot to look for evidence of possible treatment effects, period effects, and sequence effects.
- Sequence by period mean plot
-
Use the sequence by period mean plot to compare the mean response for the reference treatment and the test treatment in each period of each sequence.