A bank requires eight pieces of information from loan applicants: income, education level, age, length of time at current residence, length of time with current employer, savings, debt, and number of credit cards. A bank administrator wants to analyze this data to determine the best way to group and report it. The administrator collects this information for 30 loan applicants.
The bank administrator uses the Pearson correlation to examine the strength and direction of the linear relationship between each pair of variables.- Open the sample data, LoanApplicant.MTW.
- Choose .
- In Variables, enter Age Residence Employ Savings Debt 'Credit cards'.
- Click Graphs.
- In Statistics to display on plot, choose Correlations and intervals.
- Click OK in each dialog box.
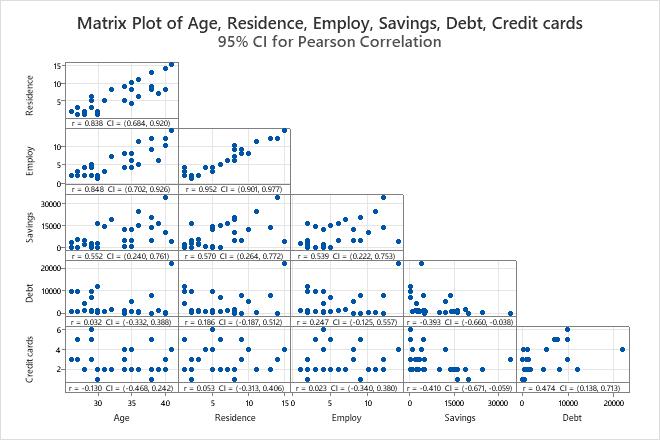
Interpret the results
- The highest Pearson correlation coefficient is between Employ and Residence. This value of 0.952 represents a positive relationship between the variables. As employment increases, residence also increases. The 95% confidence interval is 0.901 − 0.977.
- The Pearson correlation coefficient between Credit cards and Savings is –0.410. As number of credit cards increases, savings tends to decrease. The 95% confidence interval ranges from –0.671 to –0.059.
Also use the matrix plot to look for outliers that can heavily influence the results. For instance, row 6 contains an extreme data point that may influence the correlation between variables. An example of this can been seen in the Debt and Age plot.
Usually, when the correlation is stronger, the confidence interval is narrower. For instance, Credit cards and Age have a weak correlation and the 95% confidence interval ranges from -0.468 to 0.242.
Method
| Correlation type | Pearson |
|---|---|
| Number of rows used | 30 |
Correlations
| Age | Residence | Employ | Savings | Debt | |
|---|---|---|---|---|---|
| Residence | 0.838 | ||||
| Employ | 0.848 | 0.952 | |||
| Savings | 0.552 | 0.570 | 0.539 | ||
| Debt | 0.032 | 0.186 | 0.247 | -0.393 | |
| Credit cards | -0.130 | 0.053 | 0.023 | -0.410 | 0.474 |