In This Topic
R-sq
R2 is also known as the coefficient of determination.
Formula
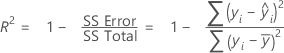
Notation
| Term | Description |
|---|---|
| yi | i th observed response value |
 | mean response |
 | i th fitted response |
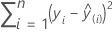
SS
The sum of the squared distances. SS Regression is the portion of the variation explained by the model. SS Error is the portion not explained by the model and is attributed to error. SS Total is the total variation in the data.
Formula


Notation
| Term | Description |
|---|---|
| yi | i th observed response value |
 | i th fitted response |
 | mean response |
PRESS
The prediction sum of squares (PRESS) statistic assesses your model's predictive ability. PRESS, similar to the residual sum of squares, is the sum of squares of the prediction error. In PLS, Minitab only calculates PRESS if you cross-validated the model.
Minitab calculates PRESS in the following steps:
- Minitab recalculates the model as many times as there are observations, omitting a different observation each time. For each omitted observation, Minitab calculates the fitted or predicted response using the model.
- Minitab subtracts the predicted value from the observed response value. This is the true prediction error because the observation fit is independent of the model.
- Once Minitab conducts this routine for all observations, Minitab calculates PRESS using the formula:
In general, the smaller the PRESS value, the better the model's predictive ability. PRESS is used to calculate the predicted R2.
Notation
| Term | Description |
|---|---|
| yi | the observed response |
 | the fitted response for the omitted observation |
| n | the number of observations |
R-sq (pred)
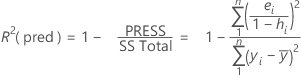
While the calculations for R2(pred) can produce negative values, Minitab displays zero for these cases.
Notation
| Term | Description |
|---|---|
| yi | i th observed response value |
 | mean response |
| n | number of observations |
| ei | i th residual |
| hi | i th diagonal element of X(X'X)–1X' |
| X | design matrix |
Test R-sq
