Note
This command is available with the Predictive Analytics Module. Click here for more information about how to activate the module.
A team of researchers wants to use data from an injection molding process to study settings for machines that maximize one type of strength of a plastic part. The variables include controls on the machines, different plastic formulas, and the injection molding machines.
As part of the initial exploration of the data, the team decides to use Discover Key Predictors to compare models by sequentially removing unimportant predictors to identify key predictors. The researchers hope to identify key predictors that have the most effect on response and gain more insight into the relationships between the response and the key predictors.
- Open the sample data set InjectionProcess.MTW.
- Choose .
- In Response, enter Strength.
- In Continuous predictors, enter Injection Pressure – Temperature at Measurement.
- In Categorical predictors, enter Machine Formula.
- Click OK.
Interpret the results
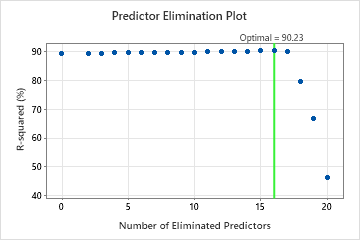
For this analysis, Minitab Statistical Software compares 20 models. The asterisk in the Model column of the Model Evaluation table shows that the model with the greatest value of the cross-validated R2 statistic is model 16. Model 16 contains 5 important predictors. The results that follow the model evaluation table are for model 16.
Although Model 16 has the greatest value of the cross-validated R2 statistic, other models have similar values. The team can click Select an Alternative Model to produce results for other models from the Model Evaluation table.
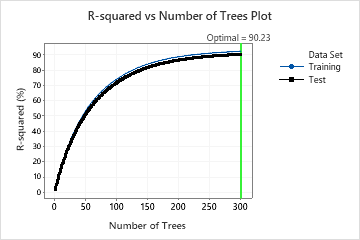
In the results for Model 16, the R-squared vs. Number of Trees Plot shows that the optimal number of trees equals the number of trees in the analysis, 300. The team can click Tune Hyperparameters to Identify a Better Model to increase the number of trees and to see whether changes to other hyperparameters improve the performance of the model.
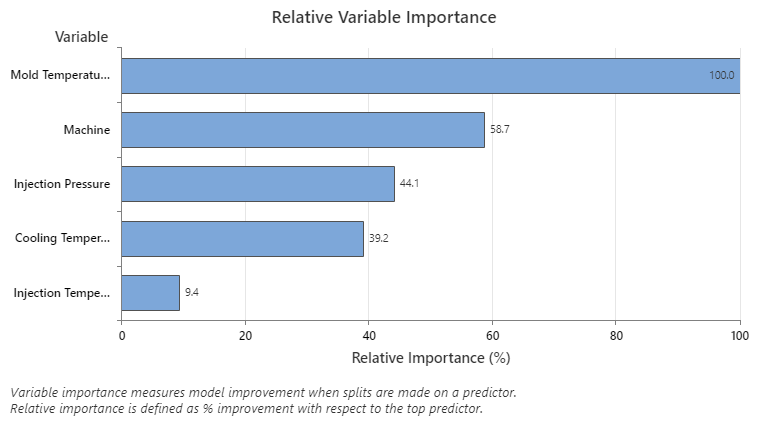
The Relative Variable Importance graph plots the predictors in order of their effect on model improvement when splits are made on a predictor over the sequence of trees. The most important predictor variable is Mold Temperature. If the importance of the top predictor variable, Mold Temperature, is 100%, then the next important variable, Machine, has a contribution of 58.7%. This means the machine that injects is 58.7% as important as the temperature inside the mold.
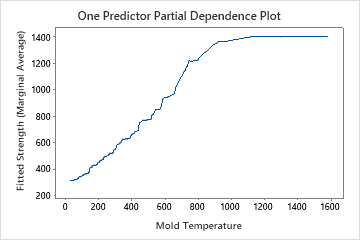
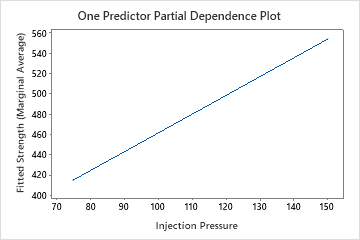
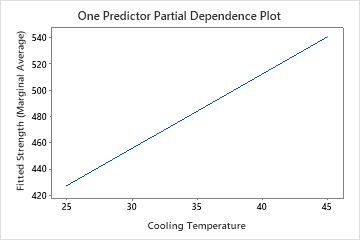
Use the partial dependency plots to gain insight into how the important variables or pairs of variables affect the predicted response. The partial dependence plots show whether the relationship between the response and a variable is linear, monotonic, or more complex.
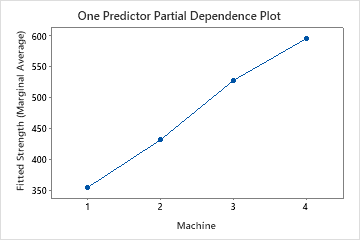
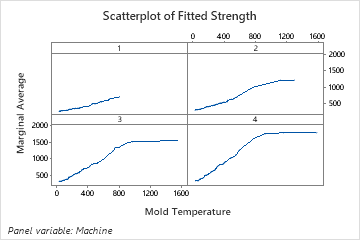
The one predictor partial dependence plots show that mold temperature, injection pressure, and cooling temperature all have a positive relationship with strength. The plot of the machines shows the differences between machines, with machine 1 making the weakest parts on average and machine 4 making the strongest parts on average. The team notices that the mold temperature and the machine have the strongest interaction in the data, so they look at the two-predictor partial dependence plot to further understand how these variables affect strength. The team can click Select More Predictors to Plot to produce plots for other variables, such as Injection Temperature.
The two-predictor partial dependence plot of Mold Temperature and Machine gives some insight into the difference average strengths for the machines. One reason is that the data from machine 1 do not include as many observations at the highest mold temperatures as the other machines. The team could still decide to look for other reasons that the machines produce different strengths when other settings are the same. The team can click Select More Predictors to Plot to produce plots for other pairs of variables.
TreeNet® Regression: Strength vs Injection Pr, Injection Te, Cooling Temp, ...
TreeNet® Regression - Discover Key Predictors: Strength vs Injection Pr, Injection Te, ...
Predictor Elimination Plot
One Predictor Partial Dependence Plots
Select More Predictors to Plot...
Two Predictor Partial Dependence Plots
Select More Predictors to Plot...
TreeNet® Regression: Strength vs Injection Pr, Injection Te, Cooling Temp, ...
One Predictor Partial Dependence Plots
Select More Predictors to Plot...
Two Predictor Partial Dependence Plots
Select More Predictors to Plot...