An engineer wants to assess the effect of sintering time on the compressive strength of three different metals. The engineer measures the compressive strength of three specimens of each metal type at each sintering time: 100 minutes, 150 minutes, and 200 minutes.
The engineer creates a multi-vari chart to look for possible trends and interactions in the data.
- Open the sample data, SinteringTime.MTW.
- Choose .
- In Responses, enter Strength.
- In Factor 1, enter SinterTime.
- In Factor 2, enter MetalType.
- Click OK.
Interpret the results
The multi-vari chart indicates a possible interaction between the type of metal and the length of sintering time. The greatest compressive strength for Metal Type 1 is obtained by sintering for 100 minutes, for Metal Type 2 by sintering for 150 minutes, and for Metal Type 3 by sintering for 200 minutes.
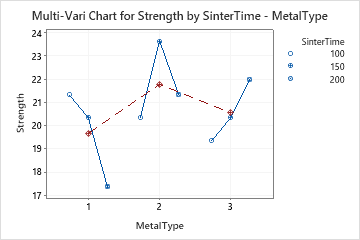
The data show that the strength varies differently across sintering times for different metal types, indicating an interaction.