The acceptance region plot is used in variables acceptance sampling. When the upper and lower specifications are known, and the standard deviation is unknown, the acceptance region plot lets you see the region of sample means and sample standard deviations for which you will accept a lot.
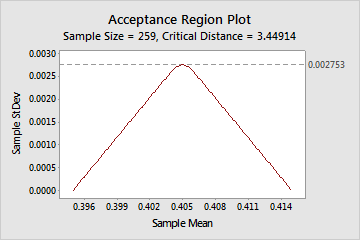
For example, you sample 259 rollers from a shipment of 3600. When the sample mean is centered between the specification limits, the process can accept the maximum standard deviation of 0.002753. When the sample mean shifts towards one of the specification limits, the variation (standard deviation) must be smaller to maintain the necessary quality for lot acceptance. The worst case would be when the mean is at the specification limit. In this case, the standard deviation must be 0, which is not possible.