Use Empirical CDF Plot to evaluate the fit of a distribution to your data, to view percentiles estimated for the population and actual percentiles for the sample values, and to compare sample distributions. Minitab plots the value of each observation against the percentage of values in the sample that are less than or equal to that value. The plotted points are connected with a stepped line, and the plot includes a fitted cumulative distribution function (CDF) line for the chosen distribution. The empirical CDF plot is similar to a probability plot except both axes are linear, which can make the empirical CDF plot more intuitive to interpret.
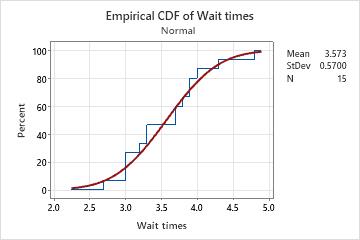
For example, a bank manager creates an empirical CDF plot to examine the distribution of customer wait times.
Where to find this graph
To create an empirical CDF plot, choose .