An informal approximation of a normality test, called "the fat pencil test", is often applied to a probability plot. Imagine a "fat pencil" lying on top of the fitted line:
- If it covers all the data points on the plot, the data are probably normal.
- If points are far enough from the fitted line that they are visible beyond the edges of the fat pencil, the data are probably nonnormal.
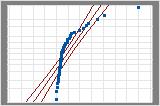
This informal approach is not a substitute for the statistical inference of the normality test itself, but it is useful as a quick visual assessment. The fat pencil test is applied to the following probability plots. The bands represent a fat pencil on top of the fitted line.

The "fat pencil test" with normal data