A plant fertilizer manufacturer wants to develop a formula of fertilizer that yields the most increase in the height of plants. To test fertilizer formulas, a scientist prepares three groups of 50 identical seedlings: a control group with no fertilizer, a group with the manufacturer's fertilizer, named GrowFast, and a group with fertilizer named SuperPlant from a competing manufacturer. After the plants are in a controlled greenhouse environment for three months, the scientist measures the plants' heights.
As part of the initial investigation, the scientist creates an interval plot of the plant heights from the three groups to evaluate the differences in plant growth between plants with no fertilizer, plants with the manufacturer's fertilizer, and plants with their competitor's fertilizer.
- Open the sample data, PlantGrowth.MTW.
- Choose one of the following:
- In Graph variables, enter Height.
- In Categorical variables for grouping (1-4, outermost first), enter Fertilizer.
- Click OK.
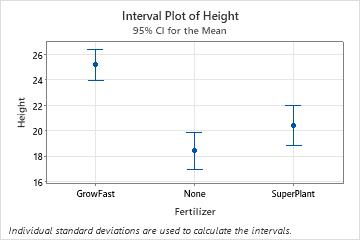
Interpret the results
GrowFast produces the plants with the highest mean height. The confidence interval for GrowFast does not overlap the other confidence intervals, which indicates that the difference may be significant. SuperPlant also increases the plant height. However, the confidence intervals of the SuperPlant group and the control group overlap, which indicates that the difference is probably not significant.
To determine whether there is a significant difference between a pair of groups, the scientist can use a One-Way ANOVA with multiple comparisons.