What is correlation?
- Pearson product moment correlation
-
The Pearson correlation evaluates the linear relationship between two continuous variables. A relationship is linear when a change in one variable is associated with a proportional change in the other variable.
For example, you might use a Pearson correlation to evaluate whether increases in temperature at your production facility are associated with decreasing thickness of your chocolate coating.
- Spearman rank-order correlation
-
The Spearman correlation evaluates the monotonic relationship between two continuous or ordinal variables. In a monotonic relationship, the variables tend to change together, but not necessarily at a constant rate. The Spearman correlation coefficient is based on the ranked values for each variable rather than the raw data.
Spearman correlation is often used to evaluate relationships involving ordinal variables. For example, you might use a Spearman correlation to evaluate whether the order in which employees complete a test exercise is related to the number of months they have been employed.
It is always a good idea to examine the relationship between variables with a scatterplot. Correlation coefficients only measure linear (Pearson) or monotonic (Spearman) relationships. Other relationships are possible.
Comparison of Pearson and Spearman coefficients
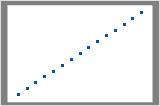
Pearson = +1, Spearman = +1
If the relationship is that one variable increases when the other increases, but the amount is not consistent, the Pearson correlation coefficient is positive but less than +1. The Spearman coefficient still equals +1 in this case.
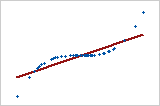
Pearson = +0.851, Spearman = +1
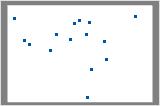
Pearson = −0.093, Spearman = −0.093
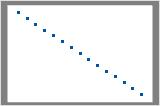
Pearson = −1, Spearman = −1
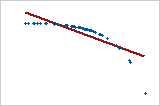
Pearson = −0.799, Spearman = −1
Correlation values of −1 or 1 imply an exact linear relationship, like that between a circle's radius and circumference. However, the real value of correlation values is in quantifying less than perfect relationships. Finding that two variables are correlated often informs a regression analysis which tries to describe this type of relationship more.
Other nonlinear relationships
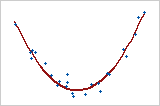
Coefficient of 0
This graph shows a very strong relationship. The Pearson coefficient and Spearman coefficient are both approximately 0.