Linearity
Linearity assesses the difference in average bias through the expected operating range of the measurement system. Linearity indicates whether the gage has the same accuracy for all sizes of objects being measured.
Formula
Linearity = | Slope | * Process Variation
%Linearity
%Linearity is linearity expressed as a percentage of the overall process variation.
Formula
%Linearity = (Linearity / Process Variation) * 100
p-value for Gage Linearity
Use the p-values for constant and slope to test whether the slope is equal to 0 and the constant is equal to 0.
The p-value is defined as the area under the sampling distribution to the right of the + |test statistic| and the area under the sampling distribution to the left of the - |test statistic|. Minitab use the t-distribution with γ df and the t-statistic to calculate the p-value.
- For the constant, if the p-value is greater than the α-value, you fail to reject the null hypothesis and conclude that the bias for all reference values is equal to 0.
- For the slope, if the p-value is greater than the α-value, you fail to reject the null hypothesis and conclude that the measurement system has the same bias for all reference values (linearity is not present).
- For the constant, if the p-value is less than the α-value, you reject the null hypothesis and conclude that the bias for all reference values is not equal to 0.
- For the slope, if the p-value is less than the α-value, you reject the null hypothesis and conclude that the measurement system does not have the same bias for all reference values (linearity is present).
R-Sq
R-Sq (R2) is the coefficient of determination, which is used to check whether a fitted line models the data well. R-Sq (R2) represents the proportion of variation in the bias that is explained by the linear relationship between the biases and the reference values.
Formula
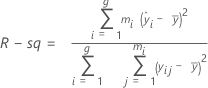
Notation
| Term | Description |
|---|---|
 | ith fitted response |
 | mean bias |
| yij | bias of the jth measurement of the ith part |
| g | number of parts |
| mi | number of replicates of the ith part |
S
S is an estimate of σ, the standard deviation around the regression line.
Formula

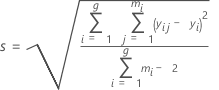
Notation
| Term | Description |
|---|---|
| xi | reference value for part i |
| yij | bias of the jth measurement of the ith part |
| g | number of parts |
| mi | number of replicates of the ith part |
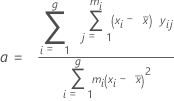
Slope, Constant
The regression line of the Bias versus Reference value plot takes the form:
Formulas
The slope of the regression line (a):
The intercept of the regression line (b):

Notation
| Term | Description |
|---|---|
| a | slope |
| b | intercept |
| xi | reference value for part i |
 | average reference value across all parts |
| yij | bias of the jth measurement of the ith part |
| g | number of parts |
| mi | number of replicates of the ith part |
 | overall bias average |