An optimization plot is a Minitab Response Optimizer tool that shows how different experimental settings affect the predicted responses for a stored model.
- To search for variable settings with a higher composite (user-specified) desirability
- To search for lower-cost variable settings with near optimal properties
- To explore the sensitivity of response variables to changes in the design variables
- To "calculate" the predicted responses for a variable setting of interest
- To explore variable settings in the neighborhood of a local solution
For example, your company injection-molds a plastic part that must obtain certain levels of both strength and flexibility. You would like to determine the temperatures and pressures that will give the plastic the maximum strength and flexibility.
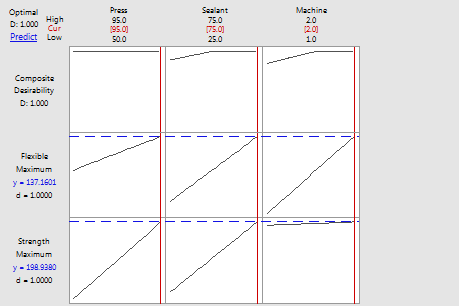
The optimization plot shows the affect of each factor (columns) on the responses or composite desirability (rows). The vertical red lines on the graph represent the current factor settings. The numbers displayed at the top of a column show the current factor level settings (in red). The horizontal blue lines and numbers represent the responses for the current factor level.
Minitab calculates that strength and flexibility are maximized when all factors are at their highest settings (Press=95, Sealant=75, and Machine=2).
Note
Double-click the graph to open interactive mode. From here, you can investigate how the responses change when the factor levels change. You can also click Predict on the toolbar to display the fitted value and prediction intervals for the current settings in the output.
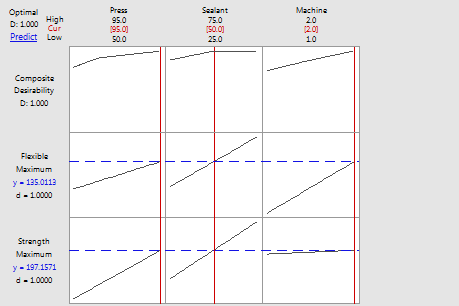 The plot shows that with a Sealant factor level of 50, the predicted strength is 197.157 and the predicted flexibility is 135.011.
Note
If you have a mixture model, the Predict button is disabled in the toolbar. To predict for specific settings in a mixture design, you must go back to the Analyze Mixture Design dialog box.