Note
This command is available with the Predictive Analytics Module. Click here for more information about how to activate the module.
Select the analysis options.
- Criterion for selecting optimal model
- Choose between the following criteria to select the optimal number of basis
functions for the model. This selection does not affect the search for the basis
functions. If the 2 criteria select the same number of basis functions, then the
models from the 2 criteria are the same.
- R-squared: Select this option to display results for the model with the maximum R-squared value.
- Mean absolute deviation: Select this option to display results for the model with the least mean absolute deviation.
- Maximum number of basis functions
- The default value of 30 works well in most cases. Consider a larger value when 30 basis functions seems too small for the data. For example, consider a larger value when you believe that more than 30 predictors are important.
- Minimum number of observations between knots
-
- Allow MARS® to choose
- The analysis uses sample size and model complexity to automatically select a value. The automatic value works well in most cases.
- User specified
- A value of 1 indicates that consecutive data points are eligible to be points where the basis function changes. The value of 1 allows the most rapid changes in the model predictions. Consider different values to see the effect on the fit of the model. For example, for some data larger values create smoother models that are less likely to overfit the training data. Such smoother models are sometimes less accurate over certain ranges of the data.
- Disable transformations for the following predictors
- Enter a continuous predictor so that the predictor can have only a linear effect
on the response variable. Another way to describe this effect is that every
predictor has only 1 basis function with a knot at the minimum value of the
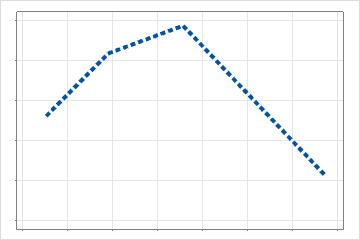
predictor. For example, suppose a predictor in an additive model has multiple
basis functions to model curvature. The partial dependence plot that results for
a predictor with 3 basis functions has the following form:
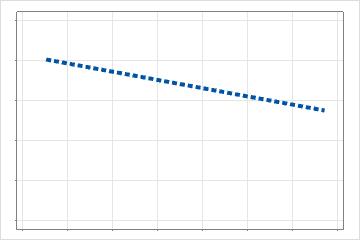
- Without a transformation for the predictor, the predictor has only 1 basis
function. The partial dependence plot that results from 1 basis function is a
straight line:
- Weights
- Enter a column that contains the case weights. The column must have the same number of rows as the response column. Values must be ≥ 0. Minitab omits rows that contain missing values or zeros from the analysis.