Control limits are the horizontal lines above and below the center line that are used to judge whether a process is out of control. The upper and lower control limits are based on the random variation in the process. By default, Minitab's control limits are displayed 3 standard deviations above and below the center line.
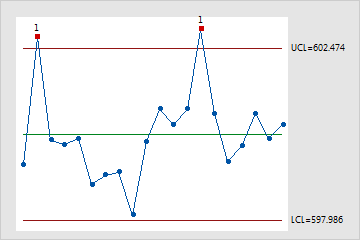
For example, this Xbar chart displays the length of manufactured camshafts over time. Two points are above the upper control limit. These out-of-control points indicate that the camshafts in these subgroups are longer than expected.
Do not confuse control limits with specification limits. Control limits are based on process variation. Specification limits are based on customer requirements. A process can be in control and yet not be capable of meeting specifications.