Interquartile range boxes
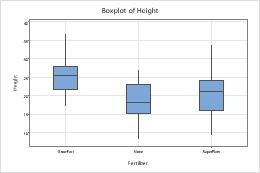
Interquartile range boxes appear by default on boxplots. To edit interquartile range boxes, select and double-click the boxes that you want to edit. For more information on selecting boxes, go to Select groups and single items on a graph.
- Edit the appearance of the boxes
- On the Attributes tab, you can edit the fill type, fill color, line type, and line color of the selected boxes.
Tip
To change the default settings and attributes for graph elements, choose .
- Edit the box endpoints
-
On the Options tab, under Box Endpoints, select one of the following:
- Quartiles: (default) Display the box bottom at the 1st quartile (25th percentile) and box top at the 3rd quartile (75th percentile).
- Hinges: Like quartiles, hinges measure the middle half of the data, but they are calculated differently. In practice, the hinges may be a bit closer to the median than the quartiles are, but in most cases this difference is not noticeable unless the data set is very small.
- Percentile: Use percentiles to define the bottom and top of the box. Enter a percentile between 0 and 50.
- Remove the whiskers
- On the Options tab, under Whiskers, select None.
- Edit the box widths
- On the Options tab, select Box width proportional to sample size to make the width of each box proportional to the square root of the sample size.
Note
If you are using a boxplot with groups, you can also assign attributes to the interquartile range boxes based on the groups in your data. For more information, go to Display groups on graphs.
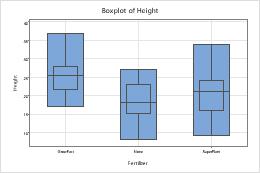
Add range boxes to an existing graph
- Double-click the graph.
- Right-click the graph and choose .
Edit range boxes
You can edit the fill type, fill color, line type, line color, and width of range boxes.
- Double-click the graph.
- Select and double-click the boxes that you want to edit.
Note
For more information on selecting range boxes, go to Select groups and single items on a graph.
- Make the edits that you want.
- Edit the appearance of the boxes
- On the Attributes tab, you can edit the fill type, fill color, line type, and line color of range boxes.
Tip
To change the default settings and attributes for graph elements, choose .
- Edit the box widths
- On the Options tab, select Box width proportional to sample size to make the width of each box proportional to the square root of the sample size.
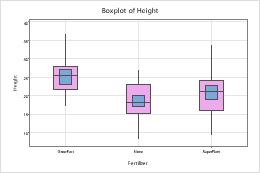
Add median confidence interval boxes to an existing graph
 To edit range boxes, complete the following steps:
- Double-click the graph.
- Right-click the graph and choose .
Edit median confidence interval boxes
You can change the appearance, confidence level, whiskers, and widths of median confidence interval boxes.
- Double-click the graph.
- Select and double-click the boxes that you want to edit.
Note
For more information on selecting range boxes, go to Select groups and single items on a graph.
- Make the edits that you want.
- Edit the appearance of the boxes
- On the Attributes tab, you can edit the fill type, fill color, line type, and line color of the selected boxes.
Tip
To change the default settings for graph elements, choose .
- Edit the confidence level
-
(Not available for marginal plots) On the Options tab, in Confidence level, enter the level of confidence for the confidence interval. Usually, a confidence level of 95% works well. A 95% confidence level indicates that, if you take 100 random samples from the population, the confidence intervals for approximately 95 of the samples will contain the median.
- Show the whiskers
- (Not available for marginal plots) On the Options tab, under Whiskers, select Show.
- Edit the box widths
- (Not available for marginal plots) On the Options tab, select Box width proportional to sample size to make the width of each box proportional to the square root of the sample size.