Use Symmetry Plot to assess whether sample data come from a symmetric distribution. Some statistical procedures require that data come from a normal distribution, but many procedures are robust to violations of normality. Thus, having data from a symmetric distribution is often adequate.
For example, an engineer wants to know whether plastic strength data is symmetric. The plot shows that the data appear to be symmetrically distributed, with no major deviations.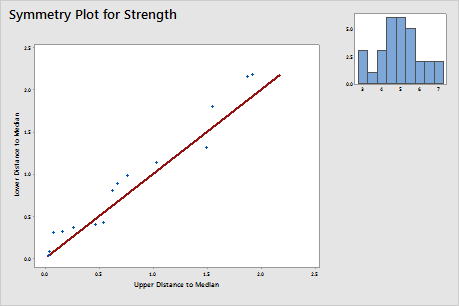
Where to find this analysis
To create a symmetry plot, choose .
When to use an alternate analysis
If you need to know whether you data come from a normal distribution, use Normality Test.