Use Z-MR Chart to monitor the mean and variation of different parts when relatively few units are made for each part, as in short-run processes.
Short run processes often do not have enough data in each run to produce good estimates of the process parameters. You can use a single machine or process to produce many different parts, or different products. For example, you may produce only 20 units of a part, then reset the machine to produce a different part in the next run. Even if the runs are large enough to obtain estimates, you would need a separate control chart for each part made by the process, because it is likely that all parts would not have the same mean and standard deviation. Short run charts provide a solution to these problems by pooling and standardizing the data in various ways. The most general method assumes that each part or batch produced by a process has its own unique average and standard deviation. If the average and the standard deviation can be obtained, then the process data can be standardized by subtracting the mean and dividing the result by the standard deviation. The Z-MR chart plots the standardized individual observations (z) and moving ranges so that you can evaluate data from different runs on a single control chart.
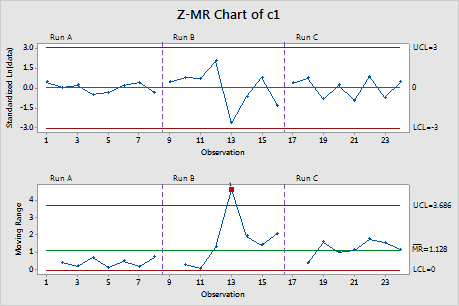
The standardized values for Run B seem to vary more than those for Run A and Run C. On the MR chart, one point is located beyond the upper control limit, and the pattern of variation is nonrandom. The process may be influenced by special causes.
Where to find this control chart
To create a Z-MR chart, choose .
When to use an alternate control chart
If your process does not involve short runs, use a I-MR Chart.