What is a sensitivity analysis?
Sensitivity analysis often follows parameter optimization, which focuses on finding optimal settings for the inputs. For more information, go to Perform a parameter optimization.
Perform a sensitivity analysis
Use the sensitivity analysis to evaluate the effects of the input variation on the output variation.
- Choose .
- If you have more than one output, a drop-down list appears so that you can choose the output that you want to examine.
-
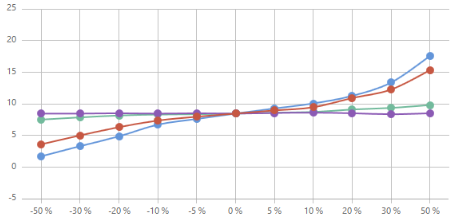
Examine the graph.
- Look for inputs that have sloped lines. Consider the relationship between changes to the standard deviation of the input and the % out-of-specification.
- Look for inputs with flat lines. These inputs have little effect on the variability so you may be able to reduce the tolerances. You can bring this information back to your engineering team for consideration.
Tip
If you prefer to evaluate the standard deviation rather than the % out-of-specification, select Standard Deviation on the y-axis label. % Out of Spec is only available when you have specification limits.
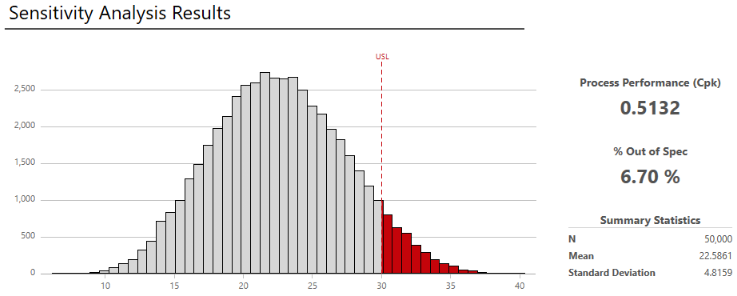
Examine the results
Engage displays the results of the sensitivity analysis, assumptions, and guidance for next steps.
-
View the results in the workspace.
You can switch between the model view and the results view of the simulation.
Note
Each time you repeat the simulation, the results will vary because the simulation is based on randomly selected values for the inputs.
- Under Assumptions, compare the new settings to the previous settings and confirm that the new settings are feasible for your application.
-
Evaluate the results, and perform any of the following tasks.
- To view capability, summary statistics, and percentiles, select More Results.
- If next steps are
available, hold the mouse pointer on
 to view more information.
- Perform another sensitivity analysis. Usually, you make changes to one input at a time so you may want to evaluate changes to other inputs.
- Repeat the sensitivity analysis with new settings until you are satisfied with the results. You can also repeat the parameter optimization. For more information, go to Perform a parameter optimization.
Edit the model
After you analyze the results, you may want to return to the model and change inputs or outputs, then rerun it. This lets you test several possible scenarios so that you can get insight into the behavior of your system and make better decisions.
-
Choose one of the following options.
- To change the model, choose . By default, Engage overwrites the existing values in the current model.
- To preserve the current settings and work in a copy, choose .
- Choose .