Note
In the web app: To add map data, such as customer demand and takt time, make sure that no shapes are selected on the value stream map, then select Data in the task pane. To add shape data, select a shape, then select Data and enter any data associated with the selected shape. To add or remove data fields from the task pane, go to Manage data fields from the task pane.
Customer demand and takt time
Enter customer demand and other facility data on the Map task pane to calculate takt time.
- Customer Demand
- The number of product units or service units that a customer requires in a certain period of time.
- Takt Time
- The cycle time required to match the pace of the customer demand.
Workspace uses
the following equation to calculate
takt time.
Takt Time = Total Production Time Available / Demand
- Hours/Day (Total production time available)
- The total production time available is the total time of a shift minus
the total time for lunch breaks, meetings, and so on.
Workspace uses
the following equation to calculate total production time available.

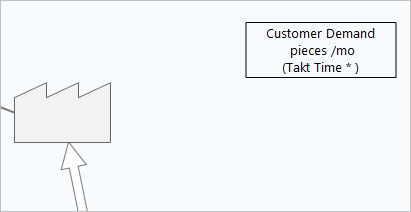
Customer demand and takt time display in the upper right corner of the value stream map.
Example
A furniture manufacturer has three 8-hour shifts. Each shift takes 30 minutes for lunch and has two 10-minute breaks for a total of 50 minutes, or 0.8 hours per shift. The customer demand is for 75 pieces per day.

Cycle time
The cycle time of a process step is the time from one completed output to the next completed output. You can enter the cycle time values in the Process task pane. You can enter Cycle Time or VA CT (value added cycle time) and NVA CT (non-value added cycle time). If you enter all three values, Workspace displays either Cycle Time or the sum of VA CT and NVA CT, whichever value is greater, on the top of the trough. VA CT is always displayed on the bottom of the trough.
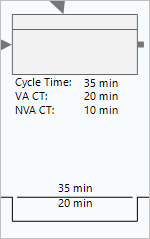
In this example, Cycle Time is 35 minutes, VA CT is 20 minutes, and NVA CT is 10 minutes. So, 35 min is displayed on the top of the trough because it is greater than the sum of VA CT and NVA CT.
If cycle time is less than or equal to 2 minutes, it is displayed in seconds on the timeline. If cycle time is less than or equal to 2 hours, it is displayed in minutes on the timeline.
If you enter VA CT and NVA CT on a process shape, cycle time is calculated on the timeline, but it is not calculated in the task pane.
Note
The Line Balancing - VSM and the Value Stream Map Comparison forms do not use cycle time values from the timeline. If you plan to use these forms, you must enter cycle time values in the task pane.
Inventory time and wait time
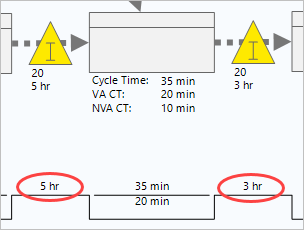
5 hr and 3 hr are on the peaks of the timeline.
- If you select
Use Takt Time,
Workspace uses the
following equation.

- If you select
Use Cycle Time,
Workspace uses the
following equation.

Note
Finished goods inventory time always uses the takt time equation. In the cycle time equation, use the following information.
- Cycle Time = the highest value from the process shape to the right of the inventory shape
- A = first pass yield or 1 – defect %, whichever value is lower
- B = machine availability %, or operator availability %, whichever value is lower
If you want to override calculated inventory time to use a known value, you must add the optional field, Inv Time to the value stream map task pane. For instructions on how to add data fields to the value stream map task pane, go to Manage data fields from the task pane.
Raw materials inventory and finished goods inventory
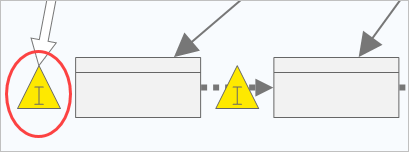
Parallel shapes on the timeline
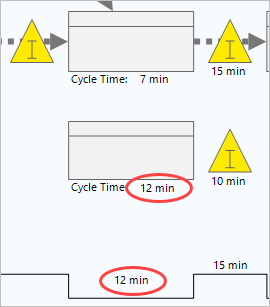
When parallel shapes are on the timeline, Workspace displays the highest value on the timeline, then uses that value to calculate total cycle time and/or lead time in the summary box.
- Parallel process shapes
- When the total cycle time of parallel process steps is calculated,
Workspace
displays the highest cycle time in the trough of the timeline. The values in
the troughs are used to calculate
Total CT.
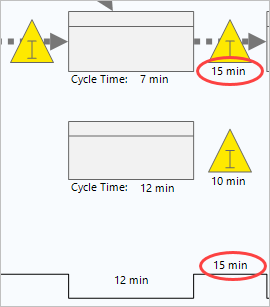
- Parallel inventory shapes
- When multiple inventory shapes occur between two process steps,
Workspace
displays the highest inventory time on the peak of the timeline. The values in
the peaks are used to calculate
Lead Time.
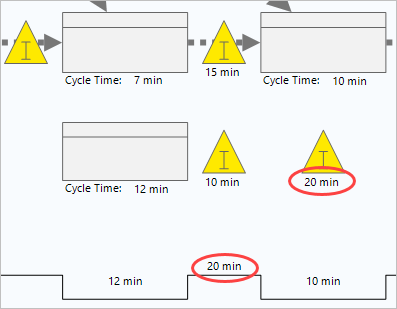
- Parallel process shapes and inventory shapes (not recommended)
- When process shapes and inventory shapes are parallel,
Workspace
displays the highest inventory time to the left of the process shape. To ensure
proper
Lead Time
calculations in the timeline summary box, avoid this scenario.
Timeline summary box
- Total CT
- The sum of all cycle time values displayed on the timeline.
- Total VA CT
- The sum of all the value-added cycle time values displayed on the timeline.
- Total NVA CT
- Total cycle time minus total value-added cycle time displayed on the timeline.
- Lead Time
- The sum of all inventory time and cycle time values displayed on the timeline.
You can include the following calculated data fields to timeline summary box by adding them to the Map task pane. For information about adding data fields to the task pane, go to Manage data fields from the task pane.
- Finished Goods Inventory Time
- Inventory time for inventory in the finished goods section of the timeline.
- Finished Goods Total Time
- The sum of inventory time and wait time in the finished goods section of the timeline.
- Finished Goods Wait Time
- The wait time in the finished goods section of the timeline.
- Process Cycle Efficiency
- The percentage of lead time that adds value or Value Added Time / Lead Time.
- Raw Materials Inventory Time
- Inventory time for inventory in the raw materials section of the timeline.
- Raw Materials Total Time
- The sum of inventory time and wait time in the raw materials section of the timeline.
- Raw Materials Wait Time
- The wait time in the raw material section of the timeline.
- Total Inventory Time
- Sum of all inventory times on the timeline.
- Total Wait Time
- Sum of all the wait times on the timeline.
- Wait Time
- A delay in processing caused by waiting.
- WIP Time
- The amount of time that a product is in process.
Lead Time – (Finished Goods Inventory Time + Raw Materials Inventory Time)