On a process map or value stream map, you can arrange data on a shape and decide
whether to show or hide the data or its labels.
Note
In the web app: To add data to a shape, right-click the shape, then select . To show or hide data labels, select Display in the task pane.
Select and arrange data fields on a shape
For a value stream map, process shapes and inventory shapes, which also
include buffer stock, supermarket, and FIFO shapes, display data on the map
after you enter values for any of the following data fields.
- Cycle Time
- VA CT
- NVA CT
- Changeover
- Inventory
- Inv Time
For process map and all other shapes on a value stream map, you must complete the following steps to arrange data fields on a shape.
- Select a shape, then choose .
-
In the
Select and Arrange Shape Data
dialog box, drag a data field from the list to the shape, then release the
mouse when you determine a location.
A red line indicates placement of the data beside the shape on the
map.
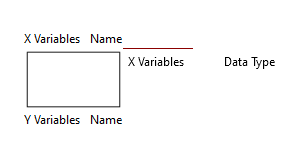
- You can select and arrange multiple data fields.
-
Select
OK.
Data displays beside the shape only if the selected data fields have
values.
- If the data field does not appear, then enter a value for it in the task pane. Go to Add data to a map.
- If the data field is not in the task pane, then you must add it. Go to Manage data fields from the task pane.
After you arrange the data on a shape, you can save it as a data format that you can apply to other shapes. For information about data formats, go to Default and custom data formats.
Show or hide data
When you add data to a shape, the process map displays the data label and
its value beside the shape. You can hide only the data labels for a selected
shape, or you can hide all shape data on the map.
- Hide data labels
- To hide only the data labels, select a shape, then choose
.
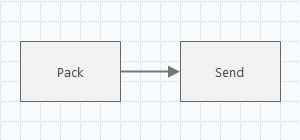
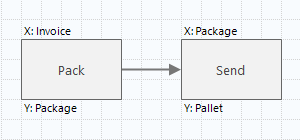
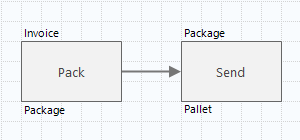
In this value stream map, only the data labels are hidden.
- Data labels shown
- Data labels hidden
- Hide all data
- To hide all shape data, choose
.
In this process map, the data labels and their values are hidden.
- All data shown
-
- All data hidden