TimeView
TimeView displays time-based charts that map out what has happened in your simulation.
Normal animated simulation displays are a vital part of understanding the dynamics of your system. However, with animated displays, it is often difficult to understand what particular set of circumstances led to a particular series of events at a later time. This is important to understand because it is often the response a company makes to individual occurrences of circumstances that can improve the efficiency of an organization without capital investment (or can affect the efficiency of a capital investment).
TimeView shows a Gantt chart-style view of the state of any of your simulation objects across time.
Setting Up TimeView

To open TimeView select TimeView from the drop-down menu on the Additional button on the Home tab.
A dialog will open showing you all the simulation objects in your simulation. Use the single > button to add one object at a time, use the double >> button to add all objects to your TimeView report.
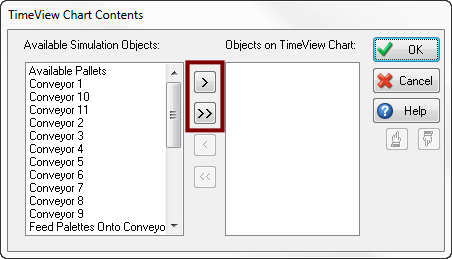
You can change the objects listed in the TimeView report at any time using the objects button on the TimeView dialog.
What the Report Means
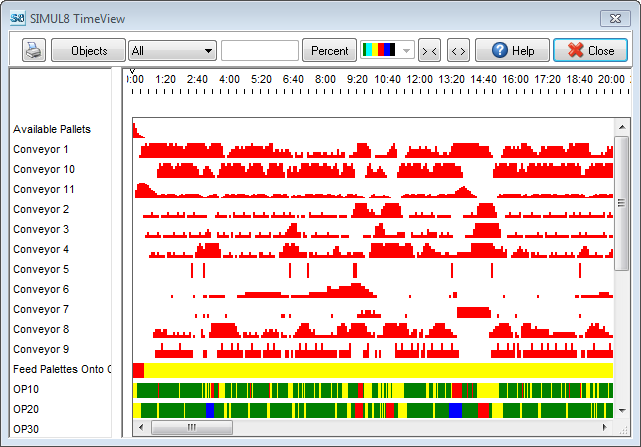
- Horizontal - Time
- Vertical - Simulation Object
The vertical axis lists all the objects you have selected onto the TimeView report. In the main (colored) part of the chart you see what happened to each of the objects as the simulation progressed over time.
Color Guide
- Red - Use of Capacity
- White - Unused Capacity
- Yellow - Waiting
- Green - Working
- Red - Blocked
- Blue - Broken Down
- White - Unused
- Green - Working
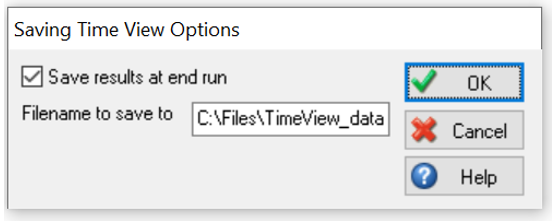
Exporting TimeView Results
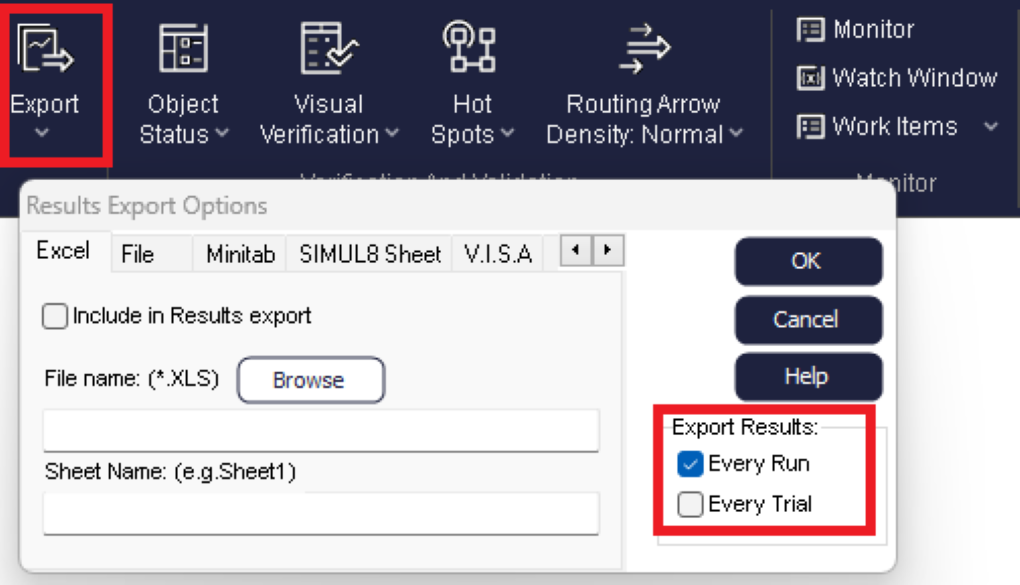
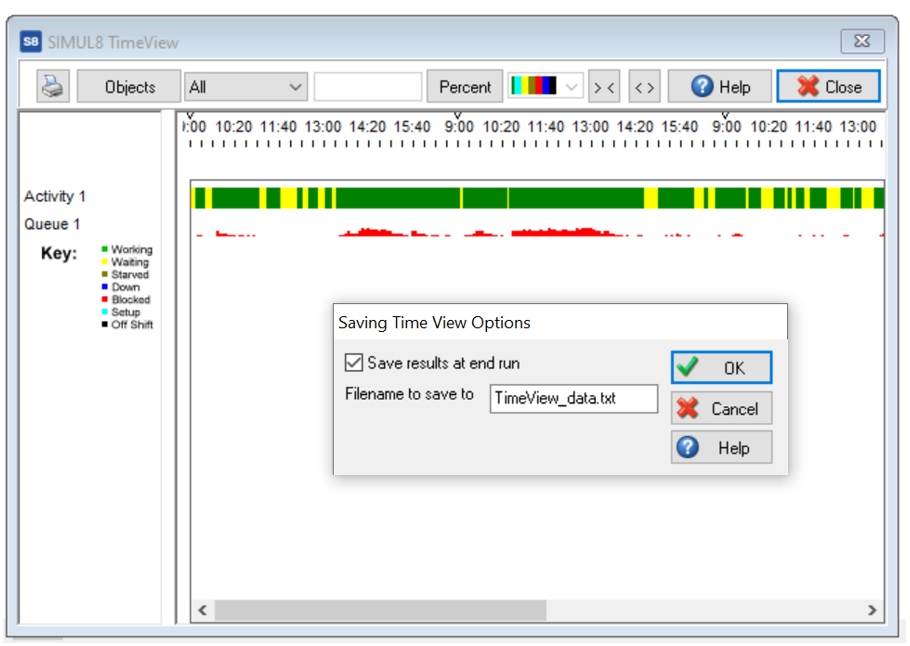
Once you save your model and carry out a Run or a Trial, this file will be saved in the same directory as your simulation model.
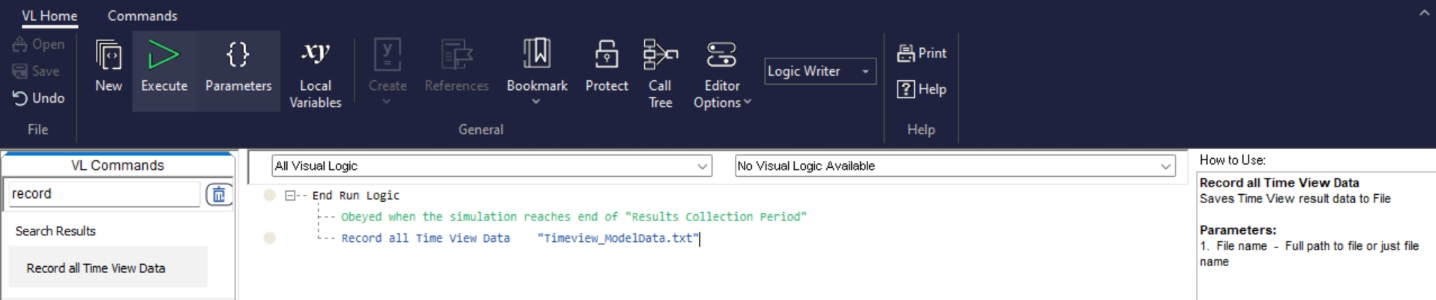
Alternatively, if you would prefer to use Visual Logic, there is a command that exports the same results.