Lean - Lead Time Chart
Lead time charts are a standard tool in the lean kit bag. They are used to analyze how long a job takes to be processed through the value stream.
Simul8 lead time charts are unique because instead of being a static representation of the
data captured in the value stream map they are live and dynamic. Instead of the
inventory time being an estimated figure entered, Simul8 accurately predicts the average
time working will spend in inventory and in the overall value stream to give a far more
accurate estimation of lead time.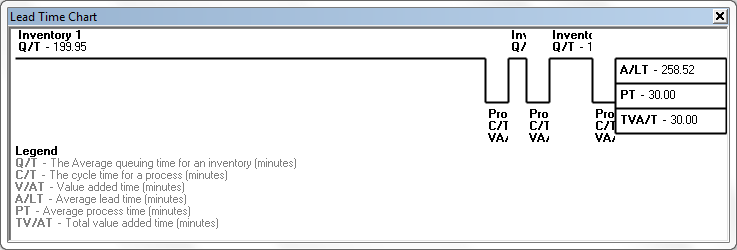
The dips in the chart represent the time the job spends in process steps. The up segments represent time spent in inventory. The width of the segments represents the proportional amount of time the work spends in each stage.
Good practice for Value Stream Maps states that value stream maps should be a high level representation of your process. For processes with extensive branching or feedback loops the lead time chart is not valid. Simul8 will only plot a single flow in this case.