Data Graphics

The Data Graphics feature allows you to display detailed information on the simulation window, attached to a simulation object.
These can be set from the Graphics dialog or tab of any object.
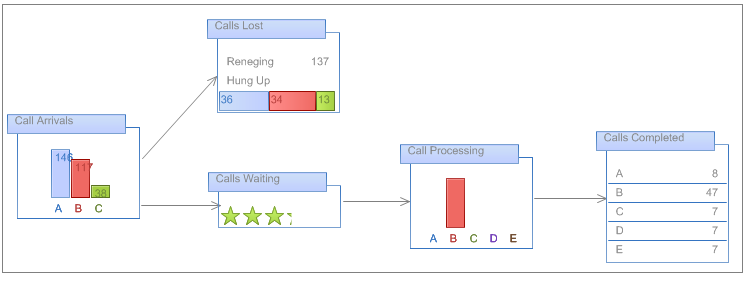
- Text lets you display numerical or text variables, or any other data in the Information Store or attributed to a Simulation Object.
- Data Bar gives the option to display a more graphics image than the Text option. Here you can set a range of different visual images representing types of bar chart, for example. This effectively allows easy creation of mini charts on the simulation window.
- Icon Set allows you to set up to five different symbols to be displayed under certain conditions next to the attached simulation object. The conditions for the display of each are set using a logical rule set for each item.
Note
When defining logical rules for an Icon Set, if 2 or more rules are true at any time the topmost icon in the list will be displayed.
The "Edit Item" Button in the Data Graphics dialog also allows you to change existing settings in a data field you have already made.
For each Data Graphics there are lots of different style and formatting options to choose from, allowing color and appearances to suit your needs.
As well as this, "Default Position" and "Display Options" of each Data Graphics can be set in the Data Graphics dialog. The position of Data Graphics can be changed by selecting a horizontal and vertical "Default Position" relative to the location of the simulation object it is attached to.