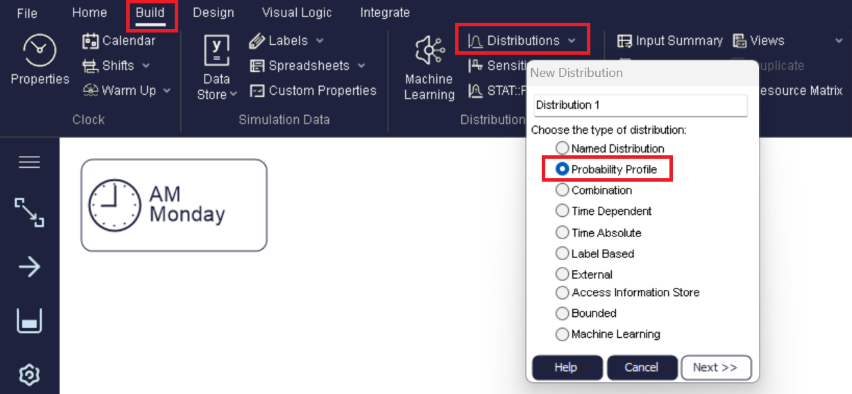
Probability Profile
A Probability Profile is a type of Distribution that sets the probability (the percentage chance) of a value being sampled from a distribution. Probability Profiles can be configured to generate any shape of Distribution desired .
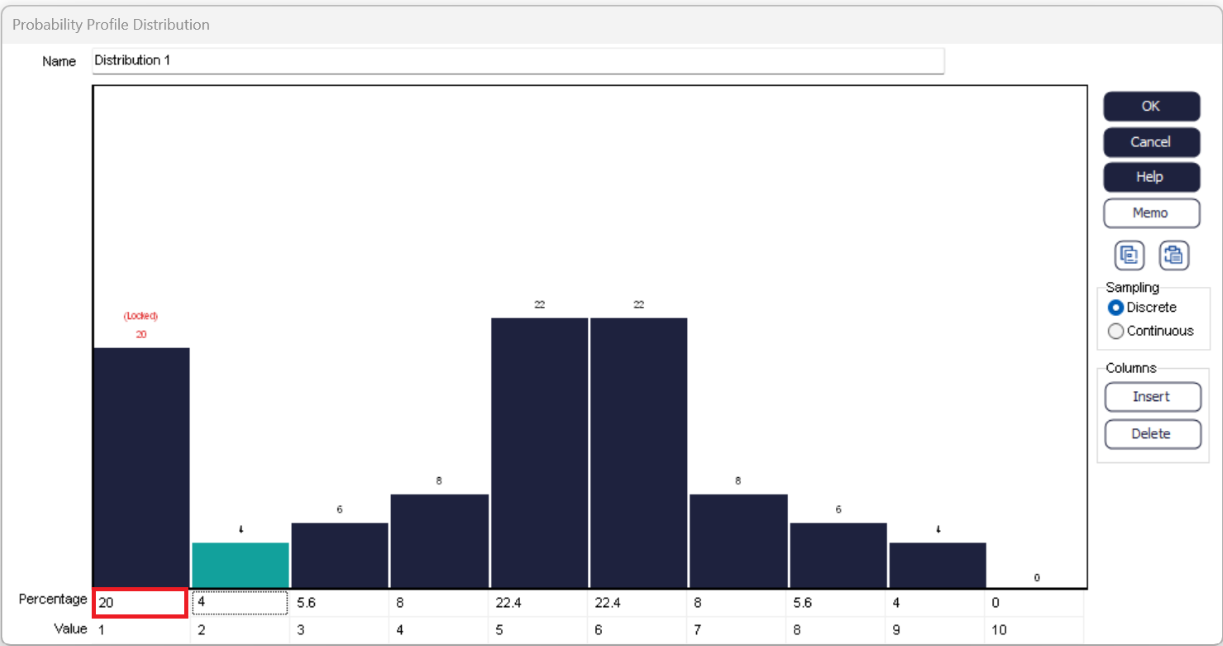
In the example shown in this picture, the value of 1 has 20% chance of being sampled.
The blue bar whose percentage chance has been changed, will automatically be resized. You can also click and drag any blue bar up or down to quickly change the probability of each sample value.
Based on the Labels Tutorial, the Probability Profile Tutorial is a step by step example of using Probability Profiles for setting Label values.
More settings of Probability Profiles
Discrete / Continuous
- Discrete
- The value sampled will always be EXACTLY one of the values that appear under the blue bars.
- Continuous
- The value sampled will be interpolated between the sample values under the blue bars to supply any value between the lowest sample value given and the highest sample value given. This enables you to specify a shape of a smooth distribution without having to enter a percentage change and sample value for an infinite number of bars.
A red line on the picture indicates the nature of the continuous distribution (if selected).
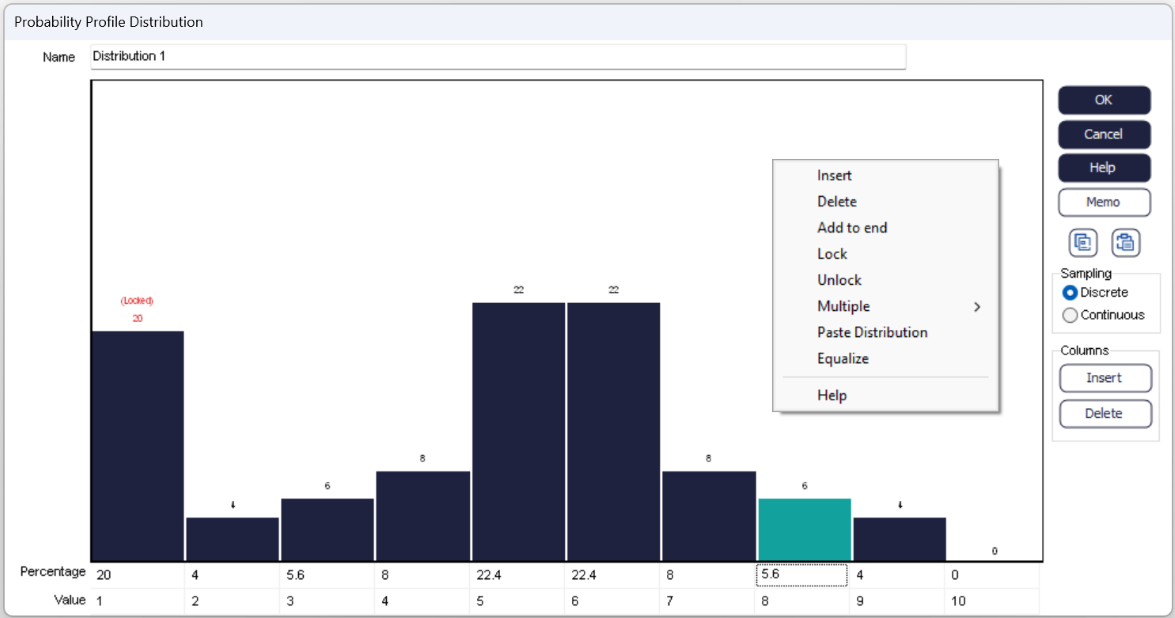
Lock/Unlock the Percentage of a Bar
Probability Profiles adjust all percentage figures so that they add up to 100%. Having set one percentage value, you may want it to stay fixed while adjusting others, this can be done using the "Lock" functionality of a Probability Profile. Locking a bar still allows the percentages to be adjusted to 100% - but the locked bar(s) are not included in the adjustment.
Locked bars are indicated by a red percentage with "(Locked)" above the bar. Bars can be locked or unlocked simply by right clicking on the selected cell and choosing Lock/Unlock for the menu.
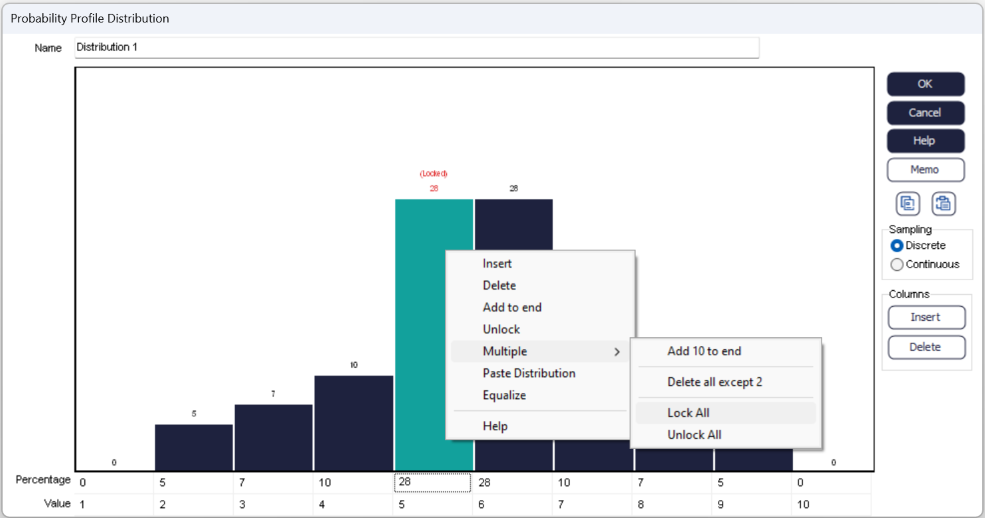
When right-clicking, you can also equalize all the unlocked percentages.
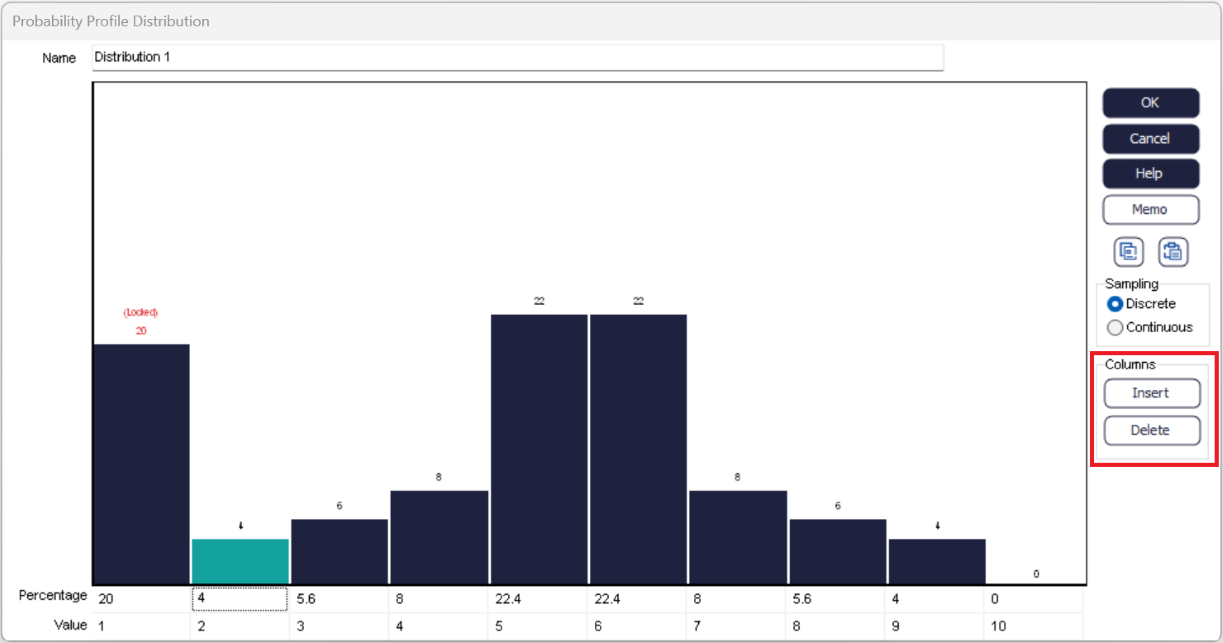
Copy/Paste
Data can be copied or pasted directly to/from a Probability Profile, this allows for Probability Profiles to be updated very quickly. Click the copy button on the right-hand side of the dialog to copy the data to your clipboard.
Clicking the paste button will clear the current distribution and will copy data from the clipboard to the distribution.
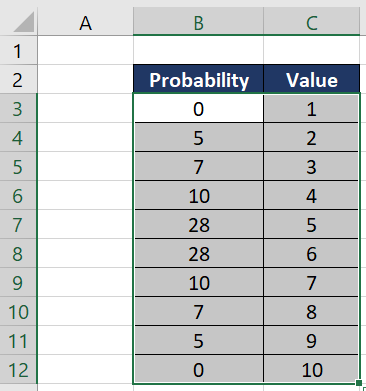
If the Probability Profile column does not add up to 100 and they appear not to be cumulative then the probabilities are adjusted. This means it is easy to paste a frequency table or percentages instead of probabilities.
Having the ability to copy the data makes sure it is in the correct format when updating the numbers.
If the last line of the pasted data has a probability value of 100 and all the probabilities are in ascending order, then the probabilities are assumed to be cumulative.