Set up the data table
Minitab Connect connects with Minitab Model Ops to receive new prediction data. First, create a Minitab Connect table to contain the new predictions. Then, create a new flow that sends the new predictions from the Model Ops API to the Connect table, then back to Minitab Model Ops.
Note
You define the name of the unique identifier column in the Settings tab. This identifier is used to match the prediction data and the stability data. It is optional for prediction requests but required for stability monitoring.
- Sign in to Minitab Connect.
- From the Home screen, select the Minitab Connect button to open the Navigation pane. Under Tables, select Add New Table. Or, from the Home screen, select the Add button under Tables.
- On the Dataset tab, enter the Name, Folder, and all other required setup properties.
- From the Tables gallery, select File/Text/Template.
- Under Import Type, select File then browse to the file that contains your prediction data. Preview the data columns to ensure you have the appropriate predictor and ID columns. Use this data ( HeartDiseaseCartPredict.csv ) to create the same Connect data table.
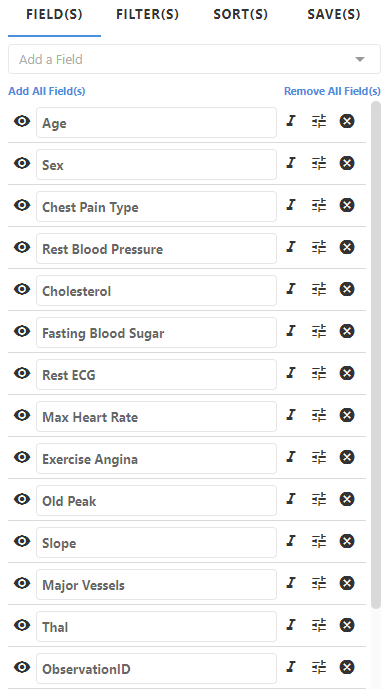
All predictors from the model have been added. We also added an optional observation ID column, ObservationID, that is optional for predictions, but required for stability monitoring.
Add new fields to the data table
Add new fields for the predicted results and the actual responses which are used to create the drift and stability reports. The stability data set must contain the actual response values and the observation IDs, which was added in the previous section.
- Open the Navigation pane. Under Tables, browse to the folder that contains your Connect data table.
- Open the table. Select the Base Tool.
- Open the Setup tab.
-
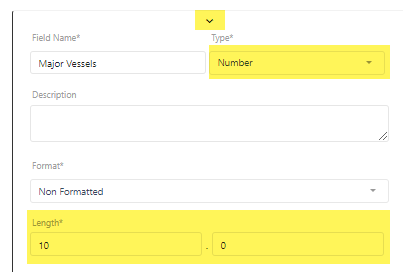
Select Click to add a field, and enter the information for the field
in the box that appears underneath for the predicted results and the actual
results. Select the expander to access additional settings for the
field.
Note
For example, you may want to format the number of decimal places in a numeric column. Open the expander and scroll to find the numeric length settings.
- Select Save.
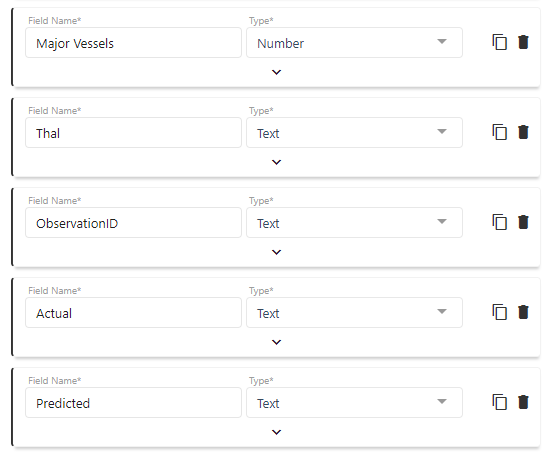
The new fields have been successfully added.