We use the Ames housing data to create a Random Forests® Regression model in Minitab.
- Open the sample data, AmesHousing.csv.
- Choose .
- In Response, enter 'Sale Price'.
- In Continuous predictors, enter 'Lot Area', 'Total Basement SF', '1st Floor SF', '2nd Floor SF', 'Garage Area SF', 'Total Rooms', 'Year Built', and 'Year Remod/Add''.
- In Categorical predictors, enter Zoning, Type, 'Heating Quality', 'Fireplace Quality', and 'Exterior Quality''.
- Select Validation.
- In Validation method, select Validation with a test set in addition to out-of-bag data.
- Select Randomly select a fraction of rows as a test set.
- In Fraction of rows, enter 0.3.
- Select Store ID column for training/test split.
- Select OK in each dialog box.
Random Forests® Regression: Sale Price vs Lot Area, Total Basement SF, 1st Floor SF, 2nd Floor SF, Garage Area SF, Total Rooms, Year Built, Year Remod/Add, Zoning, Type, Heating Quality, Kitchen Quality, Fireplace Quality, Exterior Quality
Method
| Model validation | 70/30% training/test sets |
|---|---|
| Number of bootstrap samples | 300 |
| Sample size | Same as training data size of 2047 |
| Number of predictors selected for node splitting | Square root of the total number of predictors = 3 |
| Minimum internal node size | 5 |
| Rows used | 2930 |
Response Information
| Data Set | N | % of N | Mean | StDev | Minimum | Q1 | Median | Q3 | Maximum |
|---|---|---|---|---|---|---|---|---|---|
| Training | 2047 | 69.86 | 179266 | 80159.2 | 12789 | 128500 | 158900 | 213000 | 745000 |
| Test | 883 | 30.14 | 184344 | 79182.7 | 13100 | 132000 | 167240 | 216000 | 755000 |
Model Summary
| Total predictors | 14 |
|---|---|
| Important predictors | 14 |
| Statistics | Out-of-Bag | Test |
|---|---|---|
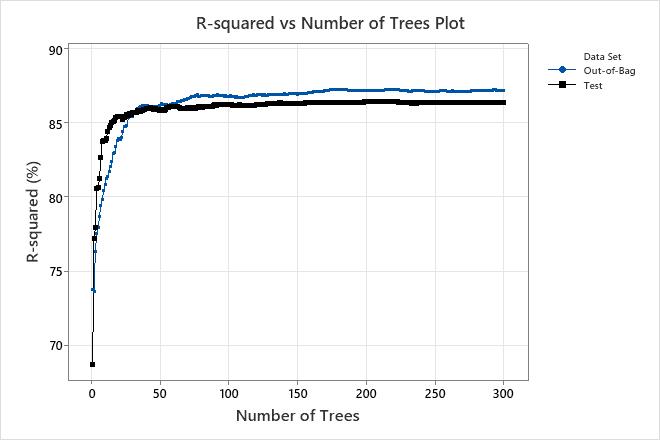
| R-squared | 87.18% | 86.36% |
| Root mean squared error (RMSE) | 28688.4432 | 29225.1724 |
| Mean squared error (MSE) | 8.23027E+08 | 8.54111E+08 |
| Mean absolute deviation (MAD) | 18135.9445 | 18573.7900 |
| Mean absolute percent error (MAPE) | 0.1124 | 0.1108 |
Save the training data
In the example above, we stored the identifiers for the training and test data. We
want to use this same data to create the MLP model. Use the following steps to save
a new worksheet with this data, or download the data from our saved worksheet.
- Choose .
- In Column, enter 'Sample_Id' and select Descending.
- In Columns to sort, select All columns.
- In Storage location for the sorted columns, select In a new worksheet.
- Select OK.