In This Topic
Report period
- Daily
- Drift and stability metrics are calculated each day and daily values are plotted over time.
- Weekly
- Drift and stability metrics are calculated each week and weekly values are plotted over time.
- Monthly
- Drift and stability metrics are calculated each month and monthly values are plotted over time.
Note
The Production Data Period setting on the Settings tab applies to the overall drift status displayed on the Deployments page and does not affect the period on the performance reports.
Start and end dates
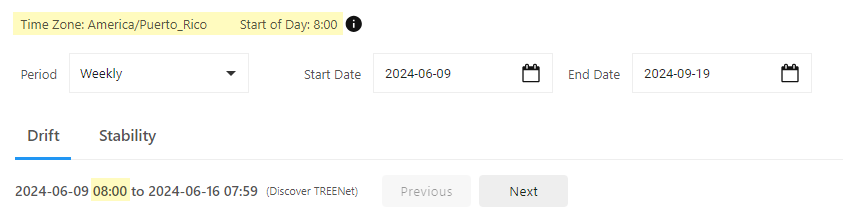
This Drift report contains weekly reports over several months. Use the navigation chips to navigate to a specific Drift report.
- If you create a new deployment on June 1 and have not imported data, the earliest report start date is June 1.
- If you create a new deployment on June 1 and have imported data from May 1 - 31, the earliest report start date is May 1.
Note
Prediction requests with prior date/time values beyond three months are not logged; thus, are not available in the drift and stability reports. Stability data are logged only if a matching correlation id was found within the last six months.
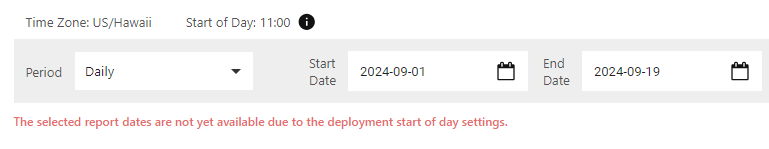
This Drift report contains daily reports. Because the deployment time zone and start of day is later than the current time, the report cannot display.
Refresh report data
Minitab Model Ops displays the date and time (in UTC time) of the last report update. If a report is not current, select Refresh Data to update.
