For moderate or severe drift, investigate the reasons for these differences and their effect on the model's performance. Also, consider whether to change the thresholds based on how well they correspond to model performance. For example, PSI tends to increase as sample sizes increase, so the possibility exists that larger thresholds are appropriate for a process with hundreds of observations per production period.
The calculation of PSI compares the percentages of data in the same categories for two samples of data. Use the following steps to calculate the PSI for a continuous variable.
- Sort the baseline data in descending order.
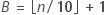
- Find the ideal size of a bin, each
containing approximately 10% of the data.
where
Term Description 
the number of observations in the bin 
the number of observations in the data set 
is the floor of 
- Add
 observations to the first bin. Tied values are added to the
same bin. Thus, bin sizes may not be equal.
observations to the first bin. Tied values are added to the
same bin. Thus, bin sizes may not be equal. - Continue for each bin. If the last
bin is less than 50% of
 , then move those observations to the previous bin.
 - Calculate the percentage of the production data in the same bins as the baseline data.
- Calculate the PSI statistic with the
following equation.
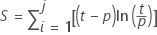
where
| Term | Description |
|---|---|
| S | the Population Stability Index (PSI) |
| j | the number of bins, usually 10 |
| t | the percent of the baseline data in the bin |
| p | the percent of the production data in the bin |
For a categorical variable, each level is a bin. Otherwise, the calculation is the same.